Silver
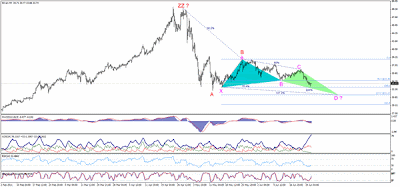
Since C wave of ZZ formation is somewhat complicated, we will analyze silver through a combination between harmonic patterns and Elliot waves. We will use a harmonic pattern that will connect the prior corrections appropriately, and a butterfly harmonic shape is the best one in this case as the metal is stable below 34.35 zones. This aforesaid harmonic structure suggests that the bearishness will continue towards 32.95 zones and a break of which will take us towards 31.35 where the first PRZ of the pattern exist. ADX reinforces the bullishness, while MACD is negative. RSI shows oversold signal and Stochastic might cause fluctuation during the downside journey.
The trading range for today is among the key support at 31.35 and key resistance now at 35.65.
The general trend over short term basis is to the downside targeting 26.65 as far as areas of 48.50 remain intact with weekly closing.
Support: 33.60, 33.10, 32.82, 32.45, 32.20
Resistance: 33.90, 34.35, 34.80, 35.00, 35.65
Resistance: 33.90, 34.35, 34.80, 35.00, 35.65
Recommendation Based on the charts and explanations above our opinion is, selling silver around 34.00 gradually targeting 33.05,32.45 and 31.35, while the stop loss is a daily closing below 35.65 might be appropriate.
Gold
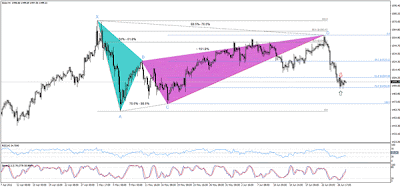
Trading is trapped between 61.8% and 76.4% Fibonacci retracement levels of CD leg for the harmonic structure as seen on the image at 1505.00 and 1492.00. The sideways direction between those levels makes the trend unclear despite RSI providing oversold signs. Stochastic is moving positively but it approaches overbought areas gradually. Henceforth, we prefer staying aside over intraday basis.
The trading range for today is among the key support at 1474.00 and key resistance now at 1532.00.
The general trend over the short term basis is to the upside targeting 1600.00 per ounce as far as areas of 1430.00 remain intact with weekly closing.
Support: 1492.00, 1488.00, 1480.00, 1477.00, 1474.00
Resistance: 1505.00, 1513.00, 1525.00, 1532.00, 1537.00
Resistance: 1505.00, 1513.00, 1525.00, 1532.00, 1537.00
Recommendation Based on the charts and explanations above our opinion is, staying aside until a clearer sign appears to pinpoint the upcoming big move.
disclaimer: The content of ecPulse.com and any page in the website contain information for investors/traders and is not a recommendation to buy or sell currencies, stocks, gold, silver & energies, nor an offer to buy or sell currencies, stocks, gold, silver & energies. The information provided reflects the writers' opinions that deemed reliable but is not guaranteed as to accuracy or completeness. ecPulse is not liable for any losses or damages, monetary or otherwise that result. I recommend that anyone trades currencies, stocks, gold, silver & energies should do so with caution and consult with a broker before doing so. Prior performance may not be indicative of future performance. Currencies, stocks gold, silver &energies presented should be considered speculative with a high degree of volatility and risk


No comments:
Post a Comment