Financial Advisor
Showing posts with label Housing. Show all posts

Italy Downgraded as Troika Call Proves Fruitless

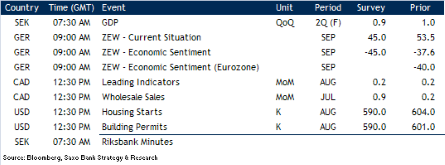
Not only did the Troika conference call yesterday not result in any concrete initiatives, but not long afterwards S&P, the ratings agency, went ahead and downgraded Italy in line with what it had earlier indicated was likely to occur. The calendar does have a few interesting numbers, but the Eurozone's struggles will be the agenda today before we gear up for the FOMC tomorrow.
Italy downgraded: One of the three big rating companies, S&P, went ahead and lowered Italy's sovereign debt rating by one notch to A from A+ previously and also slapped a negative outlook on the sovereign. The move surprised the markets with the EURUSD giving back all of the hardfought gains yesterday evening, but S&P actually had warned that such a move might take place stating in July that there is a "one-in-three likelihood that the ratings could be lowered within the next" two years. The rating agency expects Italy's economic activity wlil grow 0.7 percent annually over the coming three years which seems very low only until you consider that 1) Italy's GDP has only grown 0.2 percent annually from 2001 to 2010 and 2) that the country faces adverse effects from its coming austerity programme, which will further inhibit growth... Not exactly the perfect starting point of an attempt to lower the debt-to-GDP ratio of 119 percent and public deficit-to-GDP of 4.6 percent (December 2010 numbers).

Greece-Troika conference call proves fruitless: Despite the insistence of Greek Finance Minister Venizelos that the conference was "productive" the end result was weak by any standards with an agreement to schedule another conference call today in which further talks about the data will take place. The announcement afterwards said that a deal is close by, only to be followed up by the statement that some work is still needed to quantify measures. With the markets pricing in a near perfect probability of default let us see how long the charade will continue before the inevitable happens and Greece defaults, in an orderly or inorderly manner.

Building permits to decline in the U.S.: Yesterday's weak NAHB Housing Market Index printing 14 in September down from 15 last month did nothing to change the dismal outlook for the U.S. housing market. Today's Housing Starts and Building Permits report is expected to show declines in both to 590,000. The latter is part of the Conference Board's Leading Indicators Index.
(Note the disruptions in permits in 2010 caused by the First Time Homebuyer Tax Credit programme)

FOMC meeting commences today: The expanded two-day FOMC meeting commences today at 13:00 GMT with the (unchanged) rate decision tomorrow at 18:15. Will the committee announce QE3, Operation Twist or a third monetary policy tool? We will have much more on this in tomorrow's piece.

Real Estate Becoming Bigger Bargain Faster in Terms of Gold

  • Gold's looking an awful lot like money...
  • Especially in real estate!
  • At least to one major real estate mogul...
  • But real estate isn't done falling yet...not by a long shot
  • How you can make the most of the gold and silver bull market...and the real estate collapse
Gary Gibson, Geneva, Florida...
Gold used in a bona fide major real estate transaction?
American Precious Metals Exchange (APMEX) has a new home in one of Donald Trump's buildings. And you won't believe what the Donald accepted as a security deposit...
"Donald Trump, for the first time ever, accepted Gold bullion as a security deposit on the commercial office space that APMEX will occupy in the Trump Building at 40 Wall Street. 'The legacy of gold as a precious commodity has transcended to become a viable currency and an accepted universal monetary standard,' said Trump. 'Central Banks around the world are holding gold as a reserve asset. It is also a terrific, potentially lucrative diversifier in a portfolio, especially with such volatility in the stock market.'"
It's almost as if gold is money...or something...
This reminds us of a theme we've visited frequently in these pages. Silver for houses.
Recall these charts we shared with you a while back:
Years ago we came to the conclusion that a $1000 face value bag of 90% silver pre-1964 U.S. coins--about 715 ounces of silver--would one day buy a nice three-bedroom house in a decent U.S. neighborhood. In 2006 the price of that bag of silver coins and that nice American house started to move aggressively toward each other.
Comparing silver and real estate prices may seem arbitrary, but it's not. The news of Trump accepting gold for a security deposit underscores the point. Gold--and silver--are bound to become mediums of exchange. That is, they are bound to be seen as money again.
You may not even have to convert your gold and silver into other currencies first in order to transact. Folks--like the Donald--will simply accept your metal as money itself.
So hold your silver and wait. Silver probably has quite a bit of upside left while real estate has a bit further down to go...

But how far down are we talking here? Today's featured article answers that question for 10 U.S. markets that are on their way down. And today's Parting Shot has some more ideas to help you make the most of real estate's remaining fall.
Whiskey & Gunpowder
by Michael B. Sauter and Douglas A. McIntyre


10 Housing Markets That Will Collapse This Year
The real estate market is already in the deepest depression in modern U.S. history. If you think it can't get any worse, think again.
In several cities, the real estate market is about to drop even more. Home values in many of those cities, such as Las Vegas, have already collapsed as unemployment has shot higher. And with no hope of quick recovery, housing prices are expected to continue to fall. 24/7 Wall St. identified ten housing markets that are expected to drop by at least another 10 percent by 2012.

Methodology: We used data from the Fiserv Case-Shiller Indexes, which track real estate activity in 380 cities. We selected those that are forecast to have the largest percent price drop between the first quarter of this year and the first quarter of next. We added several other pieces of information to our city-by-city information, including June unemployment levels, median household income, and when home prices are expected to reach their troughs in each market.

Median household income in these cities tended to be near the U.S. median, and in some cases well below. We expected to find high unemployment in these cities. This turned out to be the case. In all but one of the cities we examined, unemployment was well above the national average. The rate was over 18 percent in two of the cities. This link between unemployment and expected future drop in home prices shows again how insidious the housing price problem is.

Home prices fell from all-time highs in 2006. Home equity tapped by second mortgages had been a tremendous source of income then for families who used it for retirement saving, education, and simple consumer purchases. Three years later, many of those homes were worth less than their mortgages. A large population of homeowners still owed a second mortgage. The burden of those two home loans happened to come at a time when national unemployment rose from 4 percent in the mid-2000s to 10 percent. The mix of unemployment and high mortgage payments ripped the home market apart.

The ten markets on the 24/7 Wall St. list of "Housing Markets That Will Collapse This Year," and several other like them, may not see a full recovery in home prices for years. Inventories in these markets tend to be large. Demand tends to be low as the unemployed cannot be buyers.

Finally, fear of further price drops all exacerbate the problem. No person or organization, including the federal government, has been able to help support the housing market, although the administration has tried. Not a single plan has built even a thin net under home values, despite the best efforts of the best economic minds in the world.

10. Fort Lauderdale, Fla.
Expected price drop: -11.1 percent
Median family income: $58,800 (194th highest)
Unemployment rate: 11.8 percent
Median home price: $196,000 (55th highest)
Projected to hit lowest level: Q2 2013

Since 2006, home prices in Fort Lauderdale have dropped by nearly 50 percent. A full 28 percent of that drop occurred in 2009 alone. As was the case throughout most of Florida, the collapse of the housing bubble decimated the construction-based economy. The unemployment rate of nearly 12 percent is evident of the construction sector's disastrous decline. The value of the 686,000 homes in the Fort Lauderdale area is expected to get even worse through at least the second quarter of 2013. Between Q1 2011 and Q1 2012, the median home price is projected to decline an additional 11.1 percent. Between 2012 and 2013, that number will further decrease by 8.7 percent.

9. Bethesda, Md.
Expected price drop: -11.5 percent
Median family income: $114,100 (the highest)
Unemployment rate: 5.1 percent
Median home price: $417,000 (5th highest)
Projected to hit lowest level: Q3 2012
Bethesda, the extremely wealthy D.C. suburb, has the highest median family income in the country — $114,100. It also has the fifth highest median home price, at $417,000. That position may change, however, as Case-Shiller projects home values will drop by more than $60,000 by next year.

8. Salinas, Calif.
Expected price drop: -11.8 percent
Median family income: $62,100 (145th highest)
Unemployment rate: 12.8 percent
Median home price: $240,000 (34th highest)
Projected to hit lowest level: Q2 2012
Salinas is a small coastal city located 25 miles south of San Jose. Since 2006, the median value of the of the 125,000 houses there decreased in value by more than 61 percent. This is the fourth biggest decline from peak home value among all major American cities. More than 40 percent of this drop occurred in 2009, the year after the housing bubble burst. Unemployment in the city is at 12.8 percent, well above the national average of 9.2 percent. Several companies in the area, including food processing company Romco, expect to continue to lay off workers in the coming months, which should serve to further depress home values.

7. El Centro, Calif.
Expected price drop: -12.1 percent
Median family income: $43,300 (10th lowest)
Unemployment rate: 28.6 percent
Median home price: $130,000 (70th lowest)
Projected to hit lowest level: Q1 2012
El Centro is located five miles from the Mexican border, and is one of the poorest cities in the country. Median income is just $43,300 per family, the tenth-lowest in the U.S. Unemployment is at a staggering 28.6 percent. Between 2006 and 2011, home prices decreased by more than 50 percent. According to a report in the Imperial Valley press, one home was sold in the El Centro area before the recession for $390,000. In 2009, that home was listed at $200,000. Prices are expected to drop an additional 12.1 percent by the first quarter of 2012.

6. Miami, Fla.
Expected price drop: -13 percent
Median family income: $47,800 (32nd lowest)
Unemployment rate: 13.4 percent
Median home price: $175,000 (76th highest)
Projected to hit lowest level: Q2 2013
At 13.4 percent, Miami has one of the highest unemployment rates of any major American city. Home values are above average, but are down by more than 50 percent since 2006. Partially as a result of the staggering unemployment rate, the value of the city's homes are projected to decrease by another 13 percent by the first quarter of 2013. What's more disturbing, prices will then likely fall an additional 10.1 percent. If this second drop occurs, it will be by far the greatest depreciation of property values in the country in an area already decimated by current low prices.

5. Merced, Calif.
Expected price drop: -13.2 percent
Median family income: $42,900 (8th lowest)
Unemployment rate: 18.6 percent
Median home price: $112,000 (38th lowest)
Projected to hit lowest level: Q2 2012
Merced has a median family income of just $42,900, placing it among the ten poorest major cities in the country. In 2008, the city's property lost 46.1 percent of its value. This was the second-greatest depreciation in home value for a city since at least 1980. The city's median home prices are expected to drop an additional 13.2 percent by the beginning of next year.

4. Detroit, Mich,
Expected price drop: -13.4 percent
Median family income: $49,000 (47th lowest)
Unemployment rate: 12.7 percent
Median home price: $42,000 (the lowest median home price)
Projected to hit lowest level: Q2 2012
Since the recession began, Detroit has been the horror story for plummeting home values, foreclosures, vacancies, and unemployment. To date, Detroit's median home price of $42,000 is the lowest among all 385 major metropolitan areas. While the motor city has been languishing for some time before the recession, the drop in home value has been more steady, as opposed to the rapid drop-offs seen in cities in Florida, Nevada, and California. Detroit's already record-low values are expected to drop an additional 13.4 percent by the first quarter of 2012.

3. Las Vegas, Nev.
Expected price drop: -13.9 percent
Median family income: $58,900 (196th lowest)
Unemployment rate: 12.4 percent
Median home price: $140,000 (90th lowest)
Projected to hit lowest level: Q4 2012
Las Vegas was one of the center points of the meteoric growth in the first half of the 2000s, only to be followed by a catastrophic fall in the second half. Between 2008 and 2011, home prices in the city dropped by 42.3 percent, the second greatest decline in the country. Although home values in the city are already more than 58 percent off their peak, they are projected by Case-Shiller to drop an additional 13.9 percent by Q1 2012, and then 6.3 percent more by Q1 2013.

2. Riverside-San Bernardino, Calif.
Expected price drop: -15.6 percent
Median family income: $59,700 (190th highest)
Unemployment rate: 13.7 percent
Median home price: $181,000 (70th highest)
Projected to hit lowest level: Q1 2012
Like so many industrial cities in California, Riverside-San Bernadino is being affected by the recession and housing crisis more than most other parts of the U.S. Unemployment has hit 13.7 percent, home vacancy and rental vacancy rates are high, and home values are plummeting. Median home prices are down more than 55 percent from their peak in 2006. By the beginning of next year, prices are expected to drop an additional 15.6 percent, or nearly $30,000.

1. Naples, Fla.
Expected price drop: -16.6 percent
Median family income: $62,800 (137th highest)
Unemployment rate: 10.5 percent
Median home price: $225,000 (40th highest)
Projected to hit lowest level: Q4 2012
Like much of southwest Florida, Naples was one of the fastest-growing communities in the country as it prepared for the millions of baby boomers on the cusp of retirement. When the housing bubble burst, however, the thousands of construction projects for condominiums and retirement communities were halted or lost money, and home values plummeted. From peak home value in 2006, prices dropped by 55 percent. They are expected to keep falling through next year more than any major city in the country. By Q1 2012, home values will drop an additional 16.6 percent, or nearly $40,000.
Regards,
Michael B. Sauter, Douglas A. McIntyre
Michael B. Sauter is research editor of 24/7 Wall Street.

Douglas A. McIntyre is the former Chairman and Chief Executive Officer of On2 Technlologies, a leading video compression company. He was chosen to be one of the members of the inaugural Streaming Media All-Star team, the 25 people who had the most impact on streaming media over the last 10 years. He was also the Publisher of Financial World Magazine from 1983 to 1995. McIntyre has also been President and Chief Executive officer of FutureSource, LLC and President of Switchboard.com, which was, at the time, the 10th most visited website in the US. McIntyre is a magna cum laude graduate from Harvard.
Republished with permission from 24/7 Wall Street.


The Housing Market Recovery Has Vanished

Via CNN:

Any glimmer of hope that the housing market will stage a recovery in the upcoming months has vanished, thanks to the recent spate of bad economic news that has been making headlines over the past several weeks.
According to the latest analysis of home price trends in 384 markets based on the Fiserv/Case-Shiller Indexes, it will be well into the first quarter of 2013 before median home prices across the nation will even be on par with prices from the first quarter of this year.

“Every piece of bad news causes more people to be more nervous,” said David Stiff, chief economist for Fiserv, which provides information management and analyses data for the financial services industry. “The stabilization of housing markets depends greatly on household confidence in the strength of the economic recovery. Unfortunately, recent economic news has done little to build confidence.
There still, however, is no shortage of housing inventory. More than 3.75 million existing homes in June alone were on the market, according to the National Association of Realtors. At the latest rate of sales, it would take 9.5 months to exhaust that inventory, about 50% longer than what NAR considers a healthy housing market.
“I don’t think we’ll see an increase in sales until we see the economy improving,” said Fiserv’s Stiff.
CNN et. al. would have us believe that the housing (and economic) recovery have stalled because of a “recent spate of bad economic news.” The fact is, however, that the economic news has been bad for over three years – and that trend will not only continue, but accelerate.
Housing will not reach recovery until the economy improves, and that means we’re looking at about five to ten years at best. Yes, our view is contrary to mainstream analysis, but we have to remember that we not only never came out of the 2008/2009 recession, we’re actually in Depression territory, which means we’re looking at not months, but years, potentially decades.


US Pending Home Sales Soar, Best Rate Since November


Pending Home Sales (MoM):    Survey:  3.0%    Actual: 8.2%    Prior:  -11.6%    Revised: -11.3

Seasonally Adjusted(MoM%)
U.S: 8.2% vs  -11.3%
Northeast:  7.3% vs 1.7%
Midwest:  10.5% vs -9.4%
South:  4.1% vs -17.2%
West: 12.9% vs  -8.9%
Level Change
U.S:  6.7 vs  -10.5
Northeast: 4.7 vs  1.1
Midwest: 7.9 vs -7.8
South:  3.7  vs -19.0
West:  11.5 vs -8.7
Unadjusted (YoY%) Change
U.S:  15.5% vs -26.6%
Northeast: 8.4% vs -30.8
Midwest: 20.7% vs -28.9%
South: 16.0% vs -26.7%
West: 14.9% vs -19.9%
Level Change
U.S:  88.8 vs  82.1
Northeast: 69.2 vs 64.5
Midwest: 82.8  vs 74.9
South: 95.0 vs 91.3
West:  100.6 vs  89.1
Pending Home Sales (YoY):      Actual: 15.5%      Prior:  -26.8   Revised: -26.6

The Great Property Bubble of China May Be Popping

After years of housing prices gone wild, China's property bubble is starting to deflate. Residential prices are heading downward in some major cities. Tom Orlik has details from Beijing and explains how it could impact China's red-hot economy.


BEIJING—After years of housing prices gone wild, China's property bubble is starting to deflate.

[CPROP_p1]
Residential prices are heading downward in some major cities, damping some undesired real-estate speculation but raising the prospect that the Chinese economy may slow more rapidly than anticipated with profound consequences for global growth.
Real estate is a foundation of China's phenomenal growth record in the past two decades, and its health is crucial to China's construction, steel and cement sectors. Real estate is also a favored investment of Chinese looking to get better returns than bank deposits pay. Local municipalities and provinces depend on rising prices for land sales as well to fund infrastructure projects.
World Bank economists warned at a Beijing press briefing on Wednesday that a real-estate bubble was among the biggest economic risks China faces. 

Already, in nine major cities tracked by Rosealea Yao, an analyst at market-research firm Dragonomics, real-estate prices fell 4.9% in April from a year earlier. Last year, prices in those nine cities rose 21.5%; in 2009, the increase was about 10%, as China started to recover from the global economic crisis, with much steeper increases toward the end of that year.

A downturn in property and apartment prices would harm Chinese industry and investment, and crimp consumer spending. China is a "housing-led economy," says UBS economist Jonathan Anderson, who estimates that property construction alone accounted for 13% of gross domestic product in 2010, twice the share of the 1990s.

While China's anticipated growth is still well above that of other large economies, any reduction could have deep consequences. The global economy is now even more dependent on China for demand for anything from commodities to luxury goods, given the tepid recovery in the U.S. and Europe's continuing sovereign-debt problems.

CPROP

Bloomberg
A worker walks past a public housing project in Beijing.

If the Chinese housing market slows faster than people had expected, the impact would be felt in a number of markets that export heavily to China. Many Latin American and African economies have shifted their focus toward Chinese demand for their raw materials, and many Western firms, including U.S. retailers and fast-food chains, now bank on Chinese consumers feeling wealthier to make up for stagnating sales elsewhere. Also, plans by local Chinese governments to improve infrastructure loom large for heavy-equipment makers like Caterpillar Inc. 

The red-hot demand for Chinese housing that has fed such growth plans is now ebbing. Data from Soufun, a Beijing real-estate consultant, show average property prices in China in May rose 5.1% compared with the year earlier, a slowdown from rapid rises in 2009 and 2010.

China's property prices are falling, with potentially far-reaching effects world-wide. And should investors think twice for buying into Chinese firms? Hong Kong's outgoing securities regulator thinks so. WSJ's Peter Stein and Andrew LaVallee discuss.
Standard Chartered Bank estimates that China's so-called tier-two cities, such as Dalian and Tianjin, may have 20 months of housing inventory by year end, putting "substantial" pressure on prices. Standard Chartered forecasts price cuts of 10% to 20% "in many cities."

A number of analysts think official data, which have continued to show a slight rise in prices, understate the slowdown as the government can affect the numbers by pressing developers to withhold or add high-value properties to the market depending on what it wants the data to show.

[CPROP_jmp]
Ardo Hansson, lead economist at the World Bank's Beijing office, said Wednesday that China should consider boosting interest rates further to tame consumer prices and head off bubbles in housing and other assets. He didn't comment on whether the current real-estate slowdown would harm economic growth, but stressed the importance of the property sector to the Chinese economy, especially in such sectors as steel and cement.

Partly as a result of the Chinese real-estate slowdown, prices for key industrial metals used in construction have softened. Spot copper prices have lost 5% since early March, and have now fallen to around 69,000 yuan ($10,647) a ton after racking up 34% in gains between June 2010 and March this year. Major steelmakers have been consistently cutting their product prices since February.


Chinese officials, facing widespread anger from ordinary citizens who can no longer afford to buy a home, have sought to slow the rise in housing prices. The unanswered question is whether the government can manage to reduce prices gradually in a way that won't undermine economic growth.

Since January 2010, the Chinese government has introduced a number of measures to stem speculation, including boosting down-payment requirements on mortgages for second homes to 60% from 40%, barring state-owned enterprises outside the real-estate sector from investing in property and lifting the amount of cash banks must hold in reserve 11 times—essentially reducing funds banks can lend.

[CPROP_P1] 

"In some ways, [real-estate] prices are really crazy," said Guo Shuqing, chairman of China Construction Bank, in an interview last week. He says the cost of apartments in big cities is well beyond young couples' means.

Beijing has one of the most expensive real-estate markets in the world relative to the income of its citizens. Calculations based on Soufun data show that in the opening months of 2006 an average-price new apartment in China's capital would cost around $100,000—the equivalent of 32 years' disposable income for the average resident. By 2011, the average price had more than doubled to $250,000, but relatively modest increases in income mean it would now take 57 years of saving for the average resident to cover the cost.

In Shanghai, apartment sales tumbled 37% in April, to 11,000 units, compared with 17,500 units in January, according to the Shanghai Real Estate Trading Center. With business so slack, Midland Realty, a unit of Hong Kong-based Midland Holdings Ltd., closed eight of its nine offices in Shanghai. "The government's policy on purchase restrictions had a huge impact on both selling and buying, leading to transactions drying up," said Xu Feng, senior director of Midland's development center in Shenzhen.
According to Dragonomics, sales volume in the nine cities it tracks fell by about half since the start of the year. In Beijing, that has meant rising rents, say real-estate agents. Zhang Kai, an agent at Home Link in middle-class neighborhood Tuanjiehu said the number of sales had dropped by half since February and monthly rents for small apartments jumped to about 3,000 yuan ($460) in June from 2,500 yuan ($385) a month earlier. Many apartment owners don't want to sell, he said, because they are waiting for prices to turn around.

CPROP.2
AFP/Getty Images
A woman rides a bicycle by a group of newly-built properties in Hefei, a city in eastern China's Anhui province.

One real-estate agent elsewhere in Beijing said regulations that required buyers to have formal Beijing residence and proof of having paid taxes for five years straight were crimping sales.
The housing slowdown comes at a time when there is evidence China's growth is slowing. Last week, two surveys of purchasing managers showed a slowing of manufacturing activity. China, the world's second-largest economy after the U.S., grew at 9.7% in the first quarter from a year earlier. In late May, Goldman Sachs lowered its estimate of Chinese second-quarter growth to 8% from its previous estimate of 8.8% as the government continues to tighten monetary policy to fight inflation and import demand from the U.S. weakens.UBS economist Tao Wang says she thinks the price decline will be short-lived as Chinese investors, with few other options, will again pour money into real estate and as local governments push up the price of land they sell to developers. Real-estate prices will rise for another three to five years, she estimates. A sharp fall then would batter investors, banks, construction firms and other sectors.
 
—Esther Fung in Shanghai and Tom Orlik, Helen Qu and Chuin-Wei Yap in Beijing contributed to this article.

U.S. Homes: Now the Best Deal in Recorded History

U.S. Homes: Now the Best Deal in Recorded History

Now is literally the best time in recorded history to buy a house in America…

Right now – today – U.S. real estate is the most affordable it's ever been. Ever. 

When I say "affordable," I'm looking at three things: house prices, mortgage rates, and incomes.

With the Affordability Index near 200, the median family has 200% of the income necessary to buy the median home (or more specifically, to qualify for a conventional loan on the median home).

It's easy to see where we are now…

 Right now, as you know, house prices are sitting near new lows for this cycle, down by roughly one-third (depending on who's counting). And right now, mortgage rates – after ticking above 5% earlier this year – are all the way down to 4.5% again, near all-time lows.

So it's simple: With the worst house-price crash in American history, combined with the lowest mortgage rates in history, you can now afford more home than ever.

Meanwhile, hope is gone. Everyone thinks housing is hopeless. That is when a bear market ends and a new bull market begins.

At a conference I attended last month, some speakers spoke woefully of the large supply of houses for sale. That will take care of itself in time. Others bemoaned the certainty of higher interest rates in the future, which would hurt housing. But they shouldn't be so certain…

Twenty years ago, Japan faced a housing bust similar to ours. Japan's government has cut interest rates to near zero and printed money. And long-term interest rates in Japan currently sit around 1%.

Even rising interest rates won't kill housing… In the 1970s, interest rates were rising, and house prices outperformed stock prices.

The story is simple: House prices have fallen more than ever… And mortgage rates are lower than ever. If you can buy a house now (and want one), go for it.

Now is the best time in American history to do it.

Good investing,

Steve

Bank Insider Shares Housing Market Secrets

"Nobody's borrowing right now, Steve," a bank CFO told me over breakfast on Friday.

"You hear that banks aren't lending… But that's not what's going on. What's going on is Main Street America is getting killed. People simply don't have a positive net worth – they don't have assets for banks to lend against."

This banking insider gave me some surprising specifics on real estate today and some intimidating insights on what will happen when the government exits the mortgage market.

Let's hear his take on the real estate market first…

"The math for Main Street is pretty simple… Maybe half of homeowners here in Florida are underwater on their mortgages. They can't borrow money from banks when they're in bad shape like that. Another 20% can't refinance because they don't have enough equity. And another percentage is older folks are in a homesteaded house and don't want to move because their property taxes would soar."

In other words, "The population of capable consumer borrowers is very small." He said the only active market now is "starter" homes under $200,000.

So I asked him, "Who's buying?" I know people are buying… I told him about a home-inspector friend of mine. He says he's busier than he's been in years because of people buying. This home inspector friend said his new clients need the inspections done "right now" and they're doing "all-cash deals."

The bank CFO replied, "You hit the nail on the head… Those are ALL-CASH deals. We are not in that loop. This is that very small percentage of people I was talking about that have the net worth to buy. With prices at these levels, all-cash investors are certainly buying."

The latest talk is about the government exiting the mortgage market… This is a big deal, as something like over 90% of mortgages are government-backed. I asked the banker what he thought. He didn't hesitate…

"Mortgage rates would shoot up," he said. "Nobody in their right mind in my industry would lend at 4% for 30 years. If there was no government subsidy, there would be very few 30-year mortgages."

Here's how he explained it:

"Look, as a bank, I'm trying to make a 4% interest margin. If I lend the money out at 4% in a mortgage, I have to pay zero percent on deposits. I can't do that forever. What happens when I have to pay more on deposits? Four percent mortgages are not reality."

And then he asked me, "Here's an idiot-proof test… Would you lend to someone for 30 years at 4%? How about at 5%? At what rate would you be willing to accept on a loan for 30 years? I don't know about you, but I'm not willing to put 5% on my books for 30 years."

These two conclusions from the banking insider are important:
  • The problem isn't that banks don't want to lend… It's that consumers can't borrow because they don't have the net worth to borrow against. And that situation doesn't look like it will change anytime soon.
  • Thirty-year mortgages could be a thing of the past, and mortgage rates could shoot from their lows around 4% in late 2010 to 7% or more, when the government gets out of the mortgage market (like it's talking about doing now).
I wish I had a prettier picture to report. But that is part of the view from the trenches.

I've written optimistically about real estate recently. I still believe now is an excellent time to buy a house, with near-record low mortgage rates and great prices.

But if my banker friend is right – if you want a 30-year mortgage with a low interest rate – you'd better act soon, while the government is still subsidizing mortgages. If you're not in the market for a house, pass the word along to your kids or someone else who could benefit.

Mortgage rates are still near record lows, and prices are extremely cheap. In a couple years, you probably won't be able to say one of those things… and maybe both.

Good investing,

Steve
.

Billionaire Warren Buffett's Third-Best Investment

"All things considered, the third-best investment I ever made was the purchase of my home."
 
Billionaire Warren Buffett said that in his annual letter to shareholders over the weekend.
 
Buffett is bullish on housing...
 
"Home ownership makes sense for most Americans, particularly at today's lower prices and bargain interest rates," he wrote.
 
Just last week, I wrote the same thing to subscribers of my newsletter, True Wealth:
 
Now is the best time in American history to buy a house.
 
Home prices have crashed more than at any time in our lifetimes. And mortgage rates recently hit all-time lows. Houses are more affordable than ever.
 
Things are getting Less Bad. The recession is over. Housing starts bottomed, and the supply of new homes on the market peaked. Homebuilders like Toll Brothers are "back to growing," and my home inspector friend is "swamped" with business.
 
If you can buy a house, now is the time – the best time in history. While prices may not soar immediately, I believe we're seeing the lows RIGHT NOW.
 
Last week, I thought I was standing alone, saying this. But after Warren Buffett's annual letter came out over the weekend, it appears I have company... The man who is arguably the greatest investor in history agrees with me about housing.
 
One of my main conclusions in True Wealth was:
 
Homebuilding is cyclical. And I believe we've just finished the worst of this down cycle – which is the worst ever seen in our lifetimes, and likely the worst we will ever see. Now comes the upturn. Get in early... get in now.
 
In that issue of True Wealth, I specifically say what to do... which could show you gains of as much as 1,000%. (I know that number sounds crazy, but this strategy returned 1,064% in the late 1970s.)
 
If you're not a subscriber, you can still take action...
 
Last week, I said it's the best time in history to buy a house. And over the weekend, the world's best investor agreed with me.
 
You can listen to your neighbors, the government, or the news media complain about how terrible housing is. Or you can listen to the advice of the best investor in history (Buffett).
 
Who do you think has a better chance of being right?
 
U.S. housing is a fantastic deal right now. If there's any way for you to take advantage of it, you must.
 
Good investing,
 
Steve

P.S. Buffett said buying his home was the third-best investment he ever made... But what did he say were his best two investments? "Wedding rings."

The Best Time in History to Buy a House

The Best Time in History to Buy a House

Right now, is the best time in history to buy a house in America.

Today, I'll show you why… based on a few cold, hard facts.

First off, mortgage rates are lower than they've ever been in American history…

Most investors have only seen a couple decades of mortgages rates on a chart. But my friends at Global Financial Data have databases – including real estate data – that literally go back centuries.

I had dinner with the Global Financial Data team over the weekend. And they told me about their "Winans International" real estate indexes, with housing prices back to the 1800s and mortgage rates going back over a century. I had to share it with you…

Take a look at this chart of mortgage interest rates since 1900:


As you can see, current mortgage rates are the lowest in U.S. history.

When were mortgage rates even close to this low in the past? Just after World War II…

And what happened, just after World War II, when mortgage rates were this low? The greatest postwar boom in housing prices – by far.


Take a look. Mortgage rates bottomed in the mid-1950s, and house prices bottomed about the same time. Then the greatest boom in home prices in our lifetimes started.

Today we have record-low mortgage rates. And we have another thing in our favor…

Homes are more affordable than ever.

Based on the 40-year history of the Housing Affordability Index… houses are more affordable than they've ever been. Take a look…


"Affordability" takes three factors into account: home prices, your income, and mortgage rates.

Home prices have crashed. And mortgage rates are at record lows. But incomes (nationwide) haven't fallen nearly as much… So homes are now more affordable than ever.

"Most people" out there will only tell you the bad news about housing… That's the way it goes in a bear market. People drive looking in the rearview mirror.

Meanwhile, we have some darn compelling facts out there…

Home prices have fallen by a third… and mortgage rates are the lowest in history. Therefore, U.S. homes are more affordable than they've ever been.

You can listen to "most people." Or you can choose to ignore them and stick to these facts.

Based on these facts alone, now may be one of the best times in American history – even the very best time – to buy a house.

Good investing,
Steve

P.S. If you need long-term data like I showed in the charts above, talk to my friends at Global Financial Data. You can find them at www.globalfinancialdata.com

Wealthy Chinese Are Desperate to Buy Your Vacation Home


Real estate insider: Housing crash will surpass the Great Depression

From Pragmatic Capitalism:

More bad news out of the housing market today as Zillow, a leading online real estate marketplace, released its third quarter report and it largely echos what we saw in yesterday's Clear Capital report – the housing market is double dipping. Home values fell an average 4.3% in the third quarter.

Stan Humphries, the Chief Economist at Zillow, says the housing market decline is likely to surpass the Great Depression's decline and that prices are unlikely to recover before...

Read full article...


FX Update: China hikes, risk wilts

Risk appetite is pulling back after a lousy earning report and outlook from Apple Computer late yesterday and a surprise decision to raise rates by the PBOC.  Meanwhile, US banks report great results as mortgage clouds continue to gather.  Risk trades at risk here…
A hike in China
The PBOC’s decision to hike rates has served as a bit of a spanner in the works for the current market paradigm of “Easy money all around – let’s speculate wantonly!”. This is the first move by the PBOC since….2007 and suggests that the Chinese are very concerned about something here since they are willing to rock the boat in this fashion. The speculation can only be that CPI will come in very high when China releases a raft of data on Thursday. Food prices are weighted very heavily in the Chinese CPI, and grain prices are sharply higher from just a couple of months ago. This is a critical political season in China, as it sets about crafting its new 5-year plan for 2011-15 (let’s all remember that this is a command economy…). 8-10% growth forever, anyone? Forever might end within the next 12 months. While the reaction in the Chinese equity market to the PBOC hike suggests no domestic panic in China, any whiff of anything resembling a pulling of the plug on the liquidity-fest is anathema to the competitive devaluation/QE front-running theme and the market shrinking away from risk trades at the moment makes eminent sense and may have longer to run.
RBA Minutes
The RBA minutes were relatively Aussie negative, especially since the currency’s strength was mentioned as a factor in the outlook as a potential aid in easing inflation going forward. This sets up the dynamic  of: too much strength in the Aussie means the RBA is less likely to hike, which means that the AUD uptrend from here on out will be a self-limiting process, meaning downside becomes the side of least resistance in terms of volatility potential. It was also noted in the minutes that the decision was “finely balanced”. This combined with the Chinese rate hike aimed at slowing the Chinese economy has the Aussie in the hot seat for a very good reason today.
Chart: AUDUSD
The news flow today not kind to the Aussie, which could fall across the board on today’s developments. The big focus to the downside here could be the old 0.9400+ high if momentum continues in the short term.
US Housing Surprise?
Interesting to note that despite the new mortgage fiasco in the US, the NAHB survey out yesterday, which measures buyer interest for new homes and is one of the more leading indicators in the US housing market, actually ticked a few points higher in September from its lowest level in a long time in Augus. One might take this as an encouraging sign, but to some measure it is likely also due to the fading effect from the expiration of the homebuying incentive tax that ran out at the end of April and cannibalized forward demand. One might also thing that new homes might sell better in the coming few months than existing homes for those who feel they absolutely must buy a house because they are moving, but don’t want to risk the potential title/ownership hassle of an existing home. At least new homes have a clear title! The other housing related data today was actually less encouraging, as housing starts were about the same as the previous month and building permits dipped sharply. The 539k annualized in the latter figure is the third lowest figure on record.
Bank of Canada
Despite the sharp move weaker in CAD ahead of the BoC decision today, the decision itself failed to throw the currency a rope as USD selling has intensified this morning. The Bank’s statement was cautious as the Bank noted the shift to fiscal consolidation in the developed countries, where it felt growth would be weaker. Canada’s growth potential was also downgraded and the bank also expected household spending to decelerate. All in all, no major surprises, but this is clearly not a bank that is looking to hike any time soon and one would expect the market to reduce forward rate expectations to closer to neutral. Considering the news flow of the day here and the relatively large shock to the AUD uptrend from developments – one has to wonder how long AUDCAD can maintain the parity level here.
Earnings season
Perhaps the US equity market’s most important equity, Apple Computer, fell sharply overnight after earnings somewhat disappointed expectations and as product sales and margins disappointed. A cautious outlook didn’t help. This is important stuff, coming from the market’s poster child of a growth stock and a USD 275 billion company.. This morning’s focus was on Goldman Sachs’ and Bank of America’s earnings – who of course reported great results – but the latter company is at the center of the mortgage furor due to its overtaking of the most reviled mortgage lender (due to their aggressiveness in the sub-prime area and size), Countrywide Financial, in early 2008.
Looking ahead
At what point does he shut down of an entire large nation affect the Euro? Shouldn’t it be soon? And if the USD is doing well here on this consolidation in risk appetite, shouldn’t its fellow traveler the pound also be doing well? For those not wanting to read between the lines, we will simply come right out and say it: why is EURGBP trading at 0.8800 right now – shouldn’t 0.8700 be more appropriate, or even lower at the moment? It appears that the focus is definitely away from GBP at the moment as the USD is the prime mover here.
It appears that this PBOC rate hike, US mortgage situation and the bit taken out of Apple might finally be enough to trigger a reasonable consolidation of this Everything Up/US Dollar Down trade for at least a time. if momentum continues to increase here in the short term on the anti-trend will be the 1.3350 area in EURUSD and the 0.9400 area in AUDUSD. Those levels might appear rather far off, but the April top in risk appetite and subsequent May fall-out showed us what can happen when these persistent moves with virtually no retracements can mean when the downside finally does arrive in a hyper-correlated market.
Interesting to note that the USD strength is unfazed here just after the Fed’s Lockhart is out saying that the Fed needs to get big on QE if it wants to do it at all. 
Economic Data Highlights
  • EuroZone Aug. Current Account out at -7.5B vs. -4.1B in Jul.
  • EuroZone Aug. Construction Output out at -8.5% YoY vs. -6.9% YoY in Jul.
  • Germany  Oct. ZEW Survey out at -7.2 vs. -7.0 expected and -4.3 in Sep.
  • EuroZone Oct. ZEW Survey out at 1.8 vs. -2.0 expected and 4.4 in Sep.
  • UK Oct. CBI Business Optimism out at 2 vs. 8 expected and 10 in Sep.
  • UK Oct. CBI Trends – Total Orders out at -28 vs. -19 expected and -17 in Sep.
  • US Sep. Housing Starts out at 610k vs. 580k expected and 608k in Aug.
  • US Sep. Building Permits  out at 539k vs. 575k expected and 571k in Aug.
  • Canada Bank of Canada left rate unchanged at 1.00% as expected
Upcoming Economic Calendar Highlights
  • US Fed’s Evans to Speak (1340)
  • US Fed’s Dudley to Speak (1400)
  • US Fed’s Lockhart to Speak (1530)
  • US Fed’s Fisher to Speak (1650)
  • US Fed’s Kocherlakota to Speak (1720)
  • UK BoE Governor King to Speak (1850)
  • US Fed’s Bernanke to Speak (20000)
  • US Weekly API Crude Oil and Product Inventories (2030)
  • US Weekly ABC Consumer Confidence (2100)
  • US Fed’s Duke to Speak (2300)
  • Australia Aug. Westpac Leading Index (2330)
  • Japan BoJ Deputy Governor Nishimura to Speak (0130)

FX Update: Ugly US Housing Data no big deal?

FX Update: Ugly US Housing Data no big deal?

The zany action in risk markets continued, with yesterday's big rally in risk on no real catalyst yielding to a sell-off in risk on no new catalyst before the US opened strongly despite ugly housing data. This leads us to believe that short term movements are paying little attention to fundamentals, which continue to tell a rather depressing story. The question, as we cover in our latest FX Monthly is whether the complacency we have seen in recent days is something that can support markets for another month or even throughout the summer, or whether we are simply seeing a short term bump in a new downtrend in the risk appetite. Stay tuned.
Elsewhere, one of the more interesting data releases was the UK Nationwide confidence number, which plummeted all the way to 65, a full 7 points worse than expected and a level that takes us back to nearly a year ago. The weekly ABC US confidence level also disappointed once again and seems terminally stuck in a low range until the job market improves.
EuroZone woes: focus on Spain
The general EuroZone fears are fading somewhat as the main focus now is the situation in Spain, where banks are unable to get funding in the interbank market. Spanish 2-year notes are now yielding almost 3.30%, about 280 bps above German 2-year notes. Spain is currently denying rumors that the US, IMF and EUR are planning to extend a large credit line to the Spanish government.
In contrast with the situation in Spain, the risk premium on holding Italian debt, for example, actually continues to fall (though Italy has a very high public debt figure, it features much less private debt than elsewhere, a reasonable savings rate, and a far smaller budget deficit than even France, for example, so the short term funding needs are not particularly pressing).
Russian Central Bank to add AUD and CAD
An almost sure sign that it is about time to sell the AUD and CAD as the Russian Central Bank says it is planning to add the two currencies to its international reserves. The bank announced some time ago that it had "added" the Canadian dollar to its reserves, though it apparently hadn't yet "begun operations", meaning apparently that it had approved the addition without actually going to market. While the bank's potential purchases could represent a significant new support for the currencies on a day to day basis because of their relatively thin liquidity compared with the supermajor G3 currencies, central banks are notoriously bad timers of the market and Russia's exasperation with the Euro should be used as a contrarian signal on the likes of EURCAD and EURAUD in the coming weeks and months. One also wonders how much the central bank will add as a percentage of reserves when the British Pound makes up only 10% of reserves and the Japanese Yen only makes up 2%. Russia's FX and Gold reserves stand at some USD 460 billion, so 1% is a fairly hefty USD 4.6 billion, certainly enough to move markets day to day, but hardly enough to alter the landscape for the commodity currencies.
US Data
US data was a slightly mixed bag, with a marginally higher PPI than expected - pulling the rug out slightly from the deflationists, especially considering the rising dollar during late April and throughout May and plunging oil prices for most of May, though the effect of that sharp fall may not work its way into price until the June figure (and oil has rallied strongly from the May low...)
Much more attention was focused on the very ugly US Housing Starts and Building Permits numbers for May, the first full month of such data since the home buying incentives expired in late April. Housing starts were well below expectations and the lowest since December (when the first round of home buying tax incentives was expected to expire) and the Building Permits were also well below expectations and at the lowest level in 12 months. In our book, it is a bit hard to understand why this numbers are a surprise, but the building permits drop is perhaps more alarming since this is the first phase of the housing construction life cycle and suggests that builders don't expect demand to pick up a again in the near future. The takeaway from the data is that housing demand is understandably lower with the expiration of the incentives, but another month of data this low or lower should raise the level of concern as it would suggest that housing demand is actually weakening from already very low levels - especially considering the drop in mortgage rates in recent months. With the lack of any real improvement in the job market, it is hard to see housing bouncing back anytime soon, anyway.
The Industrial Production data, on the other hand, came in rather strong, though the cynics can attribute this to the later phases of the inventory rebuilding cycle.
Chart: US Industrial Production
The May Industrial Production release saw one of the steepest increases in recent history. The chart below shows where production is currently versus the last twenty years. We have just now recovered back to a level that was reached about 10 years ago for the first time.
Looking ahead
The action this morning suggests that the worst case scenario for both bulls and bears is playing out - a choppy market that makes it look like something directionally interesting is getting started, only to see an immediate direction change at the last moment. The risk rally yesterday took the bears to the maximum pain level yesterday and just beyond through key resistance, only to see that apparent "break" faded in today's trading -though we haven't yet full reversed back into the old trading range as oft his writing. Elsewhere, bond markets have snapped higher this morning from yesterday's low and suggest that equity markets and the perhaps even more emotional FX market (especially AUD and CAD crosses) have seen the pendulum swing too far in the direction of optimism. If bonds were to crumble more convincingly, then we would be more happy to jump on board for the shorter term risk rally - until then, we remain wary of this latest rally.
Later today, we have the ECB's Bini Smaghi speaking in the US, and the BoE's King is also out speaking. Bernanke is set to give a speech about financial regulation. In Asia, there is little of interest Thursday, while Europe see the SNB's Libor-target announcement (and perhaps the latest on its intervention thoughts) and the US will release the latest CPI, Weekly Jobless Claims, and Philly Fed data.
Recall that this is triple witching week for equity markets - with expiration of options, futures, and options on futures. This could be yet another reason for the treacherous back and forth trading this week in equities and the highly correlated FX risk trades.
Economic Data Highlights
  • US Weekly ABC Consumer Confidence fell to -45 vs. -43 expected and -43 last week
  • New Zealand Q2 Westpac Consumer Confidence rose to 119.3 vs. 114.7 in Q1
  • UK May Nationwide Consumer Confidence fell to 65 vs. 72 expected and vs. 75 in Apr.
  • Australia Apr. Leading Index fell to 0.0% vs. 1.0% in Mar.
  • Australia Q1 Dwelling Starts rose 4.3% QoQ vs. +7.0% expected
  • UK May Jobless Claims Change fell -30.9k vs. -20k expected
  • UK Apr. Average Weekly Earnings ex Bonus rose 1.9% YoY vs. 2.0% expected and 2.0% in Mar.
  • Switzerland Jun. ZEW Survey out at 17.5 vs. 40.5 in May
  • EuroZone May CPI rose +0.1% MoM as expected
    US May Producer Price Index fell -0.3% MoM and rose +5.3% YoY vs. -0.5%/+4.9% expected, respectively
  • US May Producer Price Index ex Food and Energy rose +0.2% MoM and +1.3% YoY vs. +0.1%/+1.1% expected, respectively
  • US May Housing Starts out at 593k vs. 648k expected and 659k in Apr.
  • US May Building Permits out at 574k vs. 625k expected and 610k in Apr.
  • US May Industrial Production rose +1.2% MoM vs. +0.9% expected
  • US May Capacity Utilization rose to 74.7% vs. 74.5% expected and 73.7% in Apr.
Upcoming Economic Calendar Highlights
  • US Weekly DOE Crude Oil and Product Inventories (1430)
  • EuroZone ECB's Bini Smaghi to Speak (1715)
  • US Fed's Plosser to Speak (1815)
  • UK BoE's King to Speak (1945)
  • US Fed's Bernanke to Speak on Financial Regulation (2145)
  • New Zealand Jun. ANZ Consumer Confidence (0300)

Ratings and Recommendations