Top Gold fund manager says these stocks will rise 200-300% faster than Gold
Mark Johnson, manager of the USAA Precious Metals and Minerals Fund - the number one precious metals mutual fund over the last 10 years - says gold stocks will gain 2% to 3% for every 1% move in gold. The fund has over 80% of its assets in mining stocks, a huge $1 billion bet on higher prices.
Its top five gold stock holdings are AngloGold Ashanti (AU), Randgold Resources Limited (GOLD), Newcrest Mining Limited, Goldcorp Inc. (GG), and Yamana Gold Inc. (AUY).
Read full article...
China Govt's Secret New Gold investment could pay 500% over next 2 Years


The Tiny $0.001 Trillion Silver Market
The Tiny $0.001 Trillion Silver Market
(Millions, Trillions and Billions, Oh My!)
by Jason Hommel, September, 2009.
The Silver Market is small. Very small. I don't think people quite understand how small it is, nor understand fully the implications, meaning how much higher silver prices must go as the market grows to accommodate future silver buyers.Confusing matters is that the terms million, billion, and trillion mean different things, in different nations, and other nations also have different notations for how to write numbers exceeding 1000. Furthermore, most Americans are also unfamiliar with the terms, since most people don't use these terms in daily life. Who needs a billion french fries? But you do need to understand the numbers, in order to interpret political events, such as the amounts being spent by Congress.
Here are the American conventions, which I use in my writings. A thousand is written as 1000 and is notated with commas as 1,000. In America, we use a comma after every three zeros, starting from the far right, so every comma signifies another multiple of 1000.
A million is a thousand thousand. 1000 x 1000 = 1,000,000, also written as a million.
A billion is a thousand million. 1,000 x 1,000,000 = 1,000,000,000 also written as a billion.
A trillion is a thousand billion. 1,000 x 1,000,000,000 = 1,000,000,000,000 also written as a trillion.
A quadrillion is a thousand trillion 1,000 x 1,000,000,000,000 = 1,000,000,000,000,000 also written as a quadrillion.
Knowing that, we can now interpret the following key figures:
The annual Federal Budget these days is about $3 trillion, which can also be written as $3000 billion, or $3,000,000 million, or $3,000,000,000,000.
http://en.wikipedia.org/wiki/
World annual silver production is about 600 million ounces. World annual silver investment is about 50-100 million ounces. All of mine production, and more, including recycling, is consumed by industry, leaving very little left over for any investment.
At $16/oz., x 75 million oz. = $1,200 million, or $1.2 billion, or $0.0012 Trillion.
Again, let's compare:
US annual government spending: $3 trillion
World annual silver investment demand: $0.0012 Trillion
Can you say, "The US government is spending way more than exists in the entire world?" I can. It sounds funny to say it, but I understand what I mean when I say it.
But that's only silver, some will protest. But adding gold to the mix does not help. Watch.
World annual gold mine production is 2500 tonnes, which is (x 32,151 oz/tonne) is 80.3 million ounces. At $1000/oz., that's $80 billion dollars, or $0.08 Trillion.
See, not even all the gold in the entire world's annual production would help the US budget. Gold would have to increase by a factor of 3000 / 80, which is 37.5 times, in order for the entire world's gold production to equal the US government's annual budget. See, gold will go way above $37,500/oz. by the time this bull market in gold is finished, because there are other people in the world who want gold in addition to the US government.
China wants gold. China has said they want $80 billion worth of gold. China has $2130 billion to spend on gold, or $2.13 trillion of foreign exchange reserves.
http://en.wikipedia.org/wiki/
If China tries to buy a mere $80 billion of gold within one year, the gold price will likely head to $1500 to $2000/oz. this year. But China does not want to push up the price of gold to make it double in price. If they do, the value of the remainder of their $2130 billion will be cut in half.
Too bad for China, they have no choice. The value of their paper money will be cut by 95% or more anyway, even if they do nothing, as other nations, besides the US and China, also want gold. So it will come down to the reality, for everyone, that some gold is better than no gold! And silver, of course, is always better than gold, because silver will increase in value much faster!
China also wants their own people to buy silver!!! !!!
http://www.youtube.com/watch?
How will $2,130 billion of China's foreign exchange reserves fit into the annual silver market of $1 billion? Think about it. Think carefully. Think hard. Think!
Here's what I think. If China's people started buying $1 billion of silver per year, the silver price would head to $25/oz.
If China's people started buying $10 billion of silver per year, the silver price would head to $75/oz.
If China's people started buying $100 billion of silver per year, the silver price would head to about $750 per oz.
Can you say "Not enough silver!"? I can. There is a world silver shortage, and there will be a world silver shortage for the next few decades to come, probably until silver exceeds thousands of dollars per ounce in price!
There is no possible way that the silver price can be contained for very long, unless they discover a way to divert investment demand away from the limited physical silver, and convince people to hold things like ETFs, or futures contracts, or 'bullion accounts' instead. Oh yes, they have. But not for long, as the truth is getting out.
Sprott's Embry warns investors to make sure ETFs backed by precious metals
http://www.mineweb.com/
The Bank of International Settlements reports there are $111 billion in "Other Precious Metals (IE, Silver) over the counter derivatives, as of Dec. 2008. (We await June 2009 stats.)
http://www.bis.org/statistics/
from
http://www.bis.org/statistics/
A man asked me this week at the JH MINT, "How'd you get into this?" I laughed and said, "The obvious!" He laughed too. What's not obvious to me is why everyone else is so deceived by paper money. It's really not all that special at all. it's just numbers on paper, signifying nothing!
Sincerely,
Jason Hommel
China Govt's Secret New Gold investment could pay 500% over next 2 Years
Oil Options Hit Highs as Verleger Predicts 44% Plunge
By Alexander Kwiatkowski and Grant Smith
Sept. 21 (Bloomberg) -- Oil traders are paying more than ever in the options market to protect against a plunge in crude prices.
The gap between prices of options betting on a decline and those that would profit from a rise in oil widened to a record 10 percentage points, according to five years of data compiled by Banc of America Securities-Merrill Lynch. Crude stockpiles in the U.S. are 14 percent larger than a year ago and OPEC is pumping 600,000 barrels a day more than the world needs, according to the International Energy Agency.
While the recovery from the first global recession since World War II pushed oil up 62 percent this year to $72.04 a barrel in New York, growth alone isn’t likely to erode the glut by the end of next year because production exceeds demand, data from the Paris-based IEA shows. A drop in prices would penalize companies from Exxon Mobil Corp. to BP Plc and exporters Russia and Saudi Arabia.
“If ever there was going to be a retreat below $60 a barrel, it is now,” Stephen Schork, president of consultant Schork Group Inc. in Villanova, Pennsylvania, said in a telephone interview. “It was a very weak summer. We came out with more gasoline than we started.”
Right to Sell
Options granting the right to sell, or put, oil in December below current prices have a so-called implied volatility of 54.3 percent, compared with 43.3 percent for the equivalent options to buy, or call, data from the New York Mercantile Exchange show.
The premium for December and other put options shows “the market is worried,” said Harry Tchilinguirian, a senior oil analyst at BNP Paribas SA in London. “If puts are pricing higher than calls, we are looking at a situation where the market is more averse to the downside and is looking for more compensation” for the option, he said.
Demand for puts may be caused by speculators betting on lower prices or by producers hedging against a decline in the value of their oil, Tchilinguirian said.
Oil inventories totaled about 2.8 billion barrels at the end of July within the 30 nations of the Organization for Economic Cooperation and Development, according to the IEA. The total is equal to 62 days of demand, and 4.6 percent more than the same time last year.
Brimming Stockpiles
Supplies are brimming on both sides of the Atlantic. U.S. distillate fuel inventories, which include heating oil and jet fuel, are the highest since 1983 at 167.8 million barrels, according to the Energy Department. U.S. gasoline supplies are 2.2 percent greater than they were in late May, the start of the peak-demand summer driving season, at 207.7 million barrels.
Gasoil stockpiles, the European equivalent of heating oil, near Europe’s refining hub of Rotterdam reached a record 3.03 million tons (23 million barrels) on Sept. 10, according to PJK International BV of Oosterhout, the Netherlands.
More than 60 million barrels of fuel is stored on tankers offshore, according to the IEA.
“There’s all this heating oil with no place to go,” Philip Verleger, a professor at the University of Calgary and head of consultant PKVerleger LLC, said in a phone interview. “I’m fairly certain we’ll see prices in the $30s this year.”
Crude rose as high as $75 a barrel on Aug. 25 as government spending to revive growth spurred demand around the world. Oil for October delivery slumped as much as $2.94, 4.3 percent, today to $68.96 a barrel on the New York Mercantile Exchange.
Gross domestic product in the U.S., the world’s biggest energy consumer, will expand by 2.4 percent in 2010, after shrinking 2.6 percent this year, according to the median estimate of 57 forecasters surveyed by Bloomberg.
Al-Naimi’s View
Saudi Arabia’s oil minister said stockpiles have become irrelevant to crude prices because of the rebound.
“Economic growth is the name of the game,” Ali al-Naimi told reporters in Vienna on Sept. 9 before a meeting of the Organization of Petroleum Exporting Countries. “Oil today is a commodity. As long as economic growth is there, the price is going to go up.”
Traders are betting with al-Naimi. Hedge-fund managers and other large speculators increased their net-long position in New York crude-oil futures 38 percent in the week ended Sept. 15 to 45,557 contracts, according to U.S. Commodity Futures Trading Commission data.
OPEC, whose members supply about a 40 percent of the world’s oil, agreed at the meeting in Vienna to maintain current production quotas and eliminate surplus production.
Above Target
The group pumped 1.2 million barrels a day above its target of 24.845 million barrels a day in August, according to Bloomberg estimates, and more is on the way. The group will increase shipments by almost 1 percent this month, according to Halifax, England-based consultant Oil Movements.
Kuwait’s OPEC delegate, Mohammed al-Shatti, said Sept. 17 a “small” reduction in output will be needed next year because of lower demand. The group agreed to record production cuts of 4.2 million barrels a day through December of last year.
Stockpiles would need to shrink by almost 1.1 million barrels a day in the OECD, close to the combined production of OPEC members Qatar and Ecuador, to get inventories to OPEC’s targeted levels a year from now, IEA data show.
The glut will cut demand at refiners from Valero Energy Corp. to Total SA as the seasonal peak in consumption approaches. The profit from turning West Texas Intermediate crude into gasoline and heating oil fell last week to $3.42 a barrel, the lowest since December. Plants in the U.S. and Europe are being idled.
Valero Energy
San Antonio, Texas-based Valero, the largest U.S. refiner, shut its plant in Aruba and is idling operations in Delaware City, Delaware. France’s Total, Repsol YPF SA of Madrid and Zug, Switzerland-based Petroplus Holdings AG have switched off refinery units in Europe.
“Combined refining margins for gasoline and heating oil have fallen to their lowest level since 2000 and refiners are going to respond by cutting runs, and cutting back on crude purchases,” said Verleger, a former U.S. Treasury adviser.
While Verleger has dropped a forecast made in July that oil would sink to $20 a barrel, traders are anticipating a decline. The Nymex’s most popular option is the right to sell December crude at $60 a barrel, with 69,244 contracts outstanding, exchange data show. The right to sell at $50 a barrel is the second most widely held. The December 60 put option rose today 47 percent to $1.66.
To contact the reporter on this story: Alexander Kwiatkowski in London at akwiatkowsk2@bloomberg.netGrant Smith in London at gsmith52@bloomberg.net
Carnage in Asia as short JPY positions squeezed aggressively
Carnage in Asia as short JPY positions squeezed aggressively
(Mount) Fujii erupts to give an early green light to USDJPY bears, but then backtracks slightly
MAJOR HEADLINES – PREVIOUS SESSION
- US Aug. Durable Goods Orders out at -2.4% vs. +0.4% expected and revised +4.8% prior
- US Sep. Final Univ. of Michigan Sentiment out at 73.5 vs. 70.5 expected and 70.2 prior
- US Aug. New Home Sales out at +0.7% m/m vs. +1.6% expected and revised +6.5% prior
- US Aug. New Home Sales out at 426k vs. 440k expected and 426k prior
- UK Sep. Hometrack Housing Survey out at +0.2% m/m, -5.6% y/y vs. +0.1%/-6.7% prior
THEMES TO WATCH – UPCOMING SESSION
(All times GMT)- US Chicago Fed National Activity Index (1230)
- GE CPI (n/a)
- US Dallas Fed Manuf. Activity (1430)
- EU ECB’s Trichet to speak (1430)
- CA BOC’s Carney to speak (1940)
In the end it was a definite “risk off” day of Friday as weak US data in the form of durable goods and new home sales outweighed any positives to be gleaned from a final Michigan sentiment survey at its highest level since early 2008.
The off-loading of JPY short positions that had started in Asia eventually persisted and USDJPY slid below the much talked-about support level at 90.0. That said, the move was not overly eventful or aggressive once the level fell and the low was only 89.51. We had to wait until the Asian open this morning to see a more dramatic reaction (more below).
In weekend news, the final official G20 communique held nothing concrete for financial markets to get their teeth into. Granted there were some risk positives to be noted from aims to keep stimulus measures in place until a more confirmed economic rebound was in place, avoid a premature withdrawal yet prepare exit strategies and maintain a target of end-2012 for tightened bank capital ratios the be implemented. However, nothing fixed was put forward and so the positives were soon discounted in a market heavily slanted towards risk aversion.
This theme came back to haunt early traders in Asia, and with a vengeance, as this liquidity conditions saw exaggerated and speedy moves with the USD gaining the upper hand and JPY shorts squeezed until they bled. The EUR received a minor boost when it was announced that Germany’s Christian Democrats, headed by Angela Merkel, had secured enough votes to form a coalition government with preferred partners the Free Democrats. However, this was very short-lived and EURUSD managed only a 25 pip rally to 1.4720 from NY’s close on Friday.
Soon after it was the USD bulls in control, with further JPY short liquidation thumping USDJPY to an eight month low at 88.25. GBP extended its recent torrential slide to a four month low at 1.5772 against the USD and a six month low against the EUR, despite weekend press comments from the BOE that recent comments from Governor Mervyn King had been misinterpreted, and that there was no policy in place to deliberately advocate a weak pound. Selling pressure came predominantly from GBPJPY long liquidation, and was powerful enough to overcome any modicum of GBP positive news when the UK Hometrack house price index showed house prices rising for the second straight month in September.
The final nail in the coffin from JPY shorts came from headline quotes from Japanese finance minister Fujii. He reportedly said the recent USDJPY moves were “not abnormal” (following his comments on Friday that he was against deliberately weakening the JPY or any other currency). With USDJPY soon at 88.23, there was an element of backtracking from the new finance minister who came out and said he was now “watching the JPY” and “stable currency moves were desirable”. He also opined that currency moves were becoming “one-sided”. That was what forced the move back to the 89.30 level.
A more measured commentary on the state of the economy (and hence its impact on the AUD) came from RBA Governor Stevens in his testimony to a parliamentary committee. He said the downturn in the Australian economy was mild and that the fiscal and monetary stimulus measures put in place earlier in the year would be unwound as private demand picks up. He also added that the central bank would guide interest rates off their record low levels as global imbalances would begin to appear if rates were kept too low for too long. Australian interest rate futures were sold off a touch on this and the AUD was offered a tad more support.
As we head into a relatively quiet data session, the question still hangs as to whether the past two sessions have merely been a market correction of a deeper magnitude than we have seen recently, or is the beginning of a more longer-lasting risk-off consolidation phase. Certainly, some pairs have already reached some near-term objectives (GBPUSD near 1.5750, USDJPY near 88.0 and EURJPY to 130.0) and the sharp moves in Asia make it ripe for a squeeze in the other direction once Europe enters the fray. However, we think there is a greater risk that this USD (and more-so JPY) bid tone will extend with rebounds becoming shallower on each occasion. Note the Japanese half-year into Wednesday, and its related corporate repatriation flows taking advantage of Japan’s HIA initiatives, will likely stand in the way of a stronger USDJPY rebound. But were Fujii’s later comments the first signs of “verbal intervention”, or merely recovery after realizing the power of his words?
For the record, German CPI and activity indices from Chicago and Dallas Fed are the only economic data releases for today/ Speeches from ECB’s Trichet and BOC’s Carney may light up markets again. But we think a bit of caution is warranted.
ABOUT THAT EUROPEAN VACATION... CANCEL IT Brian Hunt's Market Notes
ABOUT THAT EUROPEAN VACATION... CANCEL IT
A quick note for all the vacation planners out there: Don't ski in Switzerland this year, stick to Colorado. Don't sip wine in France, stick to Napa Valley.
Today's chart gives you the reason. It's the abysmal performance of the U.S. dollar in 2009.
You can view currencies like the "stock" of a country. When times are good and its finances are in order, a country's currency tends to rise. When times are bad and its finances are a debt-soaked mess, a country's currency tends to fall.
Measured against a basket of other currencies, the dollar is down 10% since the spring. This is an enormous drop for a major currency. It's a drop that has eroded the purchasing power of your savings account, the cash in your wallet, and your "vacationing power" as well. It's the sort of fall that leads American tourists in Europe to shake their heads and say, "Good lord, things are expensive here!" Our advice right now: Keep the vacation in the States.

How the World's Best Investors See the Market
By Porter Stansberry
The world's best investors don't see the market the way you do.
And I mean that literally... They look at the market through different lenses.
Most investors know how to value equities using various valuation ratios – like the price-to-earnings ratio, the price-to-book ratio, or dividend yields. These valuation studies are important when you're buying individual stocks. And they can give you some idea of whether or not the market as a whole is attractive. But... there are much better ways to see valuation in the markets.
For example, here's a chart of the S&P 500 going back to 1975. This is the way you probably look at the market today. And when you look at the market this way, it appears pretty expensive. Stocks have been mostly going up for a long time. The recent big selloffs didn't bring the S&P 500 index back down all that much... or so it seems when you look at a plain chart.

But there's a much better and more accurate way to view the markets.
The next chart is the S&P 500 again, from the same time period (starting in 1975). As you can see, this chart looks nothing like the first one. In this chart, you can plainly see the big top formed in stocks in the early 2000s. And you can see the huge mania of the 1990s – where the chart goes nearly straight up. But in this chart, the second top in stocks we saw in 2007 doesn't exist. It's like the bull market of 2002-07 never happened.
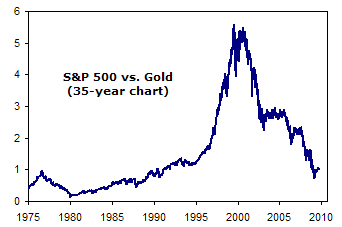
This chart is the S&P 500, but measured in gold, rather than U.S. dollars. What it shows is the value of stocks compared to gold. Gold is a much better standard of value than the U.S. dollar because it can't be printed or manipulated as easily as the U.S. dollar.
What this second chart makes clear is how cheap stocks have really become – something you can't see on the regular S&P 500 chart because of the effects of inflation.
At the bottom of stock prices in the late 1970s, just one ounce of gold (then at $800) would have bought an entire unit of the Dow Jones Industrial Average. Stocks and gold were trading on a one-to-one basis, based on this measure. At the peak of stock prices in 2000, a unit of the Dow was worth $14,000. And an ounce of gold was only worth $260. To buy the Dow would have cost more than 50 ounces of gold. Obviously, stocks were extremely expensive – 50 times more expensive than they were at the bottom in 1980.
Today, gold is trading around $1,000 an ounce. And the Dow, at its recent low, was near 6,000. It would have taken roughly six ounces of gold to buy the Dow.
Looking at stocks through the lens of gold gives you a much better idea of where we are in terms of sentiment and valuation. Using this gold ratio will help you make much better asset allocation decisions. You want to buy stocks when the ratio of the Dow to the price of gold is low – less than 10. And you want to buy gold when the ratio is high.
Using a chart just like this, my partner Bill Bonner began to tell people to buy gold and sell stocks in 2000. Using the same chart, I told Doug Casey's Gold Summit audience in March of this year to buy stocks instead of gold.
While we may not yet be at the exact bottom of the gold-to-stock ratio, we're close. I'm not telling you to sell your gold. I'm not selling mine. But looking at the chart of stocks vs. gold, you can clearly see it's time to begin to fade gold and buy stocks.
Good investing,
Porter.
China Govt's Secret New Gold investment could pay 500% over next 2 Years
The world's best investors don't see the market the way you do.
And I mean that literally... They look at the market through different lenses.
Most investors know how to value equities using various valuation ratios – like the price-to-earnings ratio, the price-to-book ratio, or dividend yields. These valuation studies are important when you're buying individual stocks. And they can give you some idea of whether or not the market as a whole is attractive. But... there are much better ways to see valuation in the markets.
For example, here's a chart of the S&P 500 going back to 1975. This is the way you probably look at the market today. And when you look at the market this way, it appears pretty expensive. Stocks have been mostly going up for a long time. The recent big selloffs didn't bring the S&P 500 index back down all that much... or so it seems when you look at a plain chart.
But there's a much better and more accurate way to view the markets.
The next chart is the S&P 500 again, from the same time period (starting in 1975). As you can see, this chart looks nothing like the first one. In this chart, you can plainly see the big top formed in stocks in the early 2000s. And you can see the huge mania of the 1990s – where the chart goes nearly straight up. But in this chart, the second top in stocks we saw in 2007 doesn't exist. It's like the bull market of 2002-07 never happened.
This chart is the S&P 500, but measured in gold, rather than U.S. dollars. What it shows is the value of stocks compared to gold. Gold is a much better standard of value than the U.S. dollar because it can't be printed or manipulated as easily as the U.S. dollar.
What this second chart makes clear is how cheap stocks have really become – something you can't see on the regular S&P 500 chart because of the effects of inflation.
At the bottom of stock prices in the late 1970s, just one ounce of gold (then at $800) would have bought an entire unit of the Dow Jones Industrial Average. Stocks and gold were trading on a one-to-one basis, based on this measure. At the peak of stock prices in 2000, a unit of the Dow was worth $14,000. And an ounce of gold was only worth $260. To buy the Dow would have cost more than 50 ounces of gold. Obviously, stocks were extremely expensive – 50 times more expensive than they were at the bottom in 1980.
Today, gold is trading around $1,000 an ounce. And the Dow, at its recent low, was near 6,000. It would have taken roughly six ounces of gold to buy the Dow.
Looking at stocks through the lens of gold gives you a much better idea of where we are in terms of sentiment and valuation. Using this gold ratio will help you make much better asset allocation decisions. You want to buy stocks when the ratio of the Dow to the price of gold is low – less than 10. And you want to buy gold when the ratio is high.
Using a chart just like this, my partner Bill Bonner began to tell people to buy gold and sell stocks in 2000. Using the same chart, I told Doug Casey's Gold Summit audience in March of this year to buy stocks instead of gold.
While we may not yet be at the exact bottom of the gold-to-stock ratio, we're close. I'm not telling you to sell your gold. I'm not selling mine. But looking at the chart of stocks vs. gold, you can clearly see it's time to begin to fade gold and buy stocks.
Good investing,
Porter.
China Govt's Secret New Gold investment could pay 500% over next 2 Years
Sterling slides anew on purported "crisis meeting". USD rally taking on water..
JPY a winner at the moment on lower rates and possible seasonal effects.
MAJOR HEADLINES – PREVIOUS SESSION
- New Zealand Q3 Westpac Consumer Confidence out at 120.3 vs. 106 in Q2
- Japan Aug. Adjusted Merchandise Trade Balance out at ¥235.4B vs. ¥187.7B expected
- Australia Aug. HIA New Home Sales rose 11.4% MoM
- Sweden Sep. Consumer Confidence rose to 5.6 vs. 6.0 expected and 3.1 in Aug.
- Sweden Sep. Manufacturing Confidence steady at -20 vs. 015 expected
- Sweden Aug. PPI out at -0.1% YoY vs. +0.5% expected
- Germany Sep. IFO Business Climate out at 91.3 vs. 92.0 expected and 90.5 in Aug.
- US Weekly Initial Jobless Claims out at 530k vs. 550k expected and 551k last week
- US Continuing Claims fell to 6138k vs. 6183k expected and 6261k last week
THEMES TO WATCH – UPCOMING SESSION
(All times GMT)- US Aug. Existing Home Sales (1400)
- US Fed's Evans to Speak (1430)
- US Treasury Secretary Geithner to Speak ahead of G-20 (2030)
- New Zealand Aug. Trade Balance (2245)
- Japan BoJ Meeting Minutes (2350)
- Japan Aug. Corporate Service Prices (2350)
USD rally fizzling quickly...
The USD rally that began so enthusiastically late yesterday after the FOMC meeting failed to keep the risk party going, has already started taking on water in today's European session. The USD bulls are having a tough time keeping a lid on EURUSD and AUDUSD and USDJPY is almost back to its recent lows. This is a bit surprising if we glance over at equity markets, which are still well off yesterday's highs in the S&P futures, though the Asian and European sessions today were fairly constructive. The JPY is the only clear winner at the moment - partially no doubt due to bond strength yesterday, though seasonal effects right here before the end of the Japanese economic half-year and rumors of corporate repatriation may also be playing a part.
Pound knocked for another round
The salient development in today's European session was a story out from the Telegraph announcing that policy makers are looking to convene a "crisis meeting" of economists next week to discuss the reasons for the pound's fall and the BoE's QE measures. The market apparently smelled fear in these actions and GBP was blasted back into the basement across the board. GBPUSD is back threatening the recent lows, with the bigger support at 1.6110 not far beyond. EURGBP set a new high since early April of this year. Speculation is swirling now on whether the policy makers could go forward with cuts on deposits by banks with the BoE, but from where we are sitting, the meeting may be more about playing defense and figuring out a way to accomplish the BoE's objectives without causing a currency panic. Competitive devaluation is one thing that could have positive effects in the near term. while a currency meltdown is to be avoided. With similar problems to the UK (fiscal profligacy, low rates, etc...) in the US, this may be one of the reasons the USD has lost steam so quickly, as the market could be playing on this theme. Still - JPY has the same problems, and it is certainly not suffering at the moment, though its current account is positive enough for it to escape the immediate vulnerability of a country with a large deficit like the UK.
Interest rates on the radar today
Today is the final of the three huge US treasury auctions this week - with $27 billion of 7-year notes on the block. Now that the FOMC is out of the way and failed to produce huge surprises, bidders may feel more comfortable than in the auctions of the last two days (of 2-year and 5-year notes, in which results ended with higher yields than initially anticipated) and they may also like the higher yields on the longer duration debt. A strong auction is likely and could continue to support the JPY (again we note the conundrum of simultaneous strength in AUD and JPY - not likely to last for long...)
FOMC outcome - glacier change, but change nonetheless.
The Fed meeting is widely interpreted as slightly on the dovish side of the spectrum of possibilities, but it nonetheless marks the important beginning of an exit strategy since it provides a time table for withdrawal for one of the Fed's "sets of tools" aimed at supporting liquidity and the flow of credit. The US economy is still on life support, but it will soon be on less life support, meaning that it will need to show a little more life on its own accord. In the economic intensive care unit, the Fed will have rolled away the debt monetization machine by the end of next month and the hulking mortgage buying machine by March of next year. Still in place, and not mentioned in the Fed's statement yesterday, are other programs like the TALF aimed at consumer credit, commercial paper facilities, and various money market-related facilities. Even discussing rate adjustments at this point is extremely premature in the US. Norway, on the other hand, is ready to tighten the screws next month.
Back to the same old same old.
All in all, the market seems to have taken the not-terribly-surprising FOMC developments and a slightly disappointing German IFO in stride, and we are back to being glued to the S&P500 for determining a direction for the USD. Also watch the G-20 for developments of interest, which may be few and far between. Note that the end of the month here could be seeing some window dressing by performance chasers, who are looking to close the gap with their benchmarks. So market activity may shift gears as the new month arrives.
US data review
US Initial jobless claims were out at the lowest level on a seasonally adjusted basis since a brief spike in July - but for perspective, we are entering the key season for job losses, and the non-seasonally adjusted number is 5% higher than the number for last week, and some 35k higher than the jobless claims for the same week last year. Hard to believe that in this "recovery" that more people are firing initial claims now than then. We should probably expect strong Existing Home Sales numbers for today, with the Fed buying 80% of mortgages and in the dying months of the first time home buyers tax credit program. It will be nice to analyze a real economy some day rather than one propped up by endless public spending.....what are equity buyers thinking?
Chart: USDJPY
The battleground at 90.00 beckons once again as the end of the half year approaches. This will be an interesting area to watch - and USDJPY is one of the few currency pairs actually seeing a rise in volatility of late.

The Easiest Way to Tell If Gold Is in a Bubble
By Chris Weber
When spot gold closed on September 11 in New York at $1,005.10, it was the highest price on record... though by the time you read this, it may have been surpassed.
Gold traded higher than this, back on March 17, 2008. When that day opened in Asia, the early morning Australian and Hong Kong markets pushed gold quickly up from $1,000 to a high – so far an all-time inter-day high – of $1,033.
But as Europe opened later in the day, the price fluctuated between $1,020 and $1,030. As the U.S. markets opened, the price plunged down to $1,000 and ended just three dollars more than this.
So if you are going by the closing trade of that day, which happens to be New York as time zones go, then what happened on Friday, September 11 broke the record.
This breakthrough has drawn a lot of publicity. Hedge funds are now heavily tilted toward the long side of the gold futures market. Many gold stocks sit near all-time highs. Mainstream newspapers and magazines are starting to carry stories about gold.
This bullish sentiment has led many people to ask me if gold is far too popular now... or even in a "bubble."
My answer: I see nothing like a bubble yet. Ask your friends or neighbors these questions:
"What do you think about gold or silver as an investment?" and if they answer in a positive manner, further ask: "What are the best ways to own it? How do you own it? What percentage of your assets do you have in the precious metals area?" If this seems too invasive, ask, "What percentage of a person's assets do you think should be in the precious metals area?"
That's what I do. The people I ask have no idea what I think about gold or silver. I ask just as a sort of person – maybe on the slow side and not that bright – who wants to know about the area.
From what I'm told, almost no one is in gold or silver. Maybe a few shares of Newmont Mining, but as a percentage of their total net worth, we are talking tiny here.
People who think gold is in a bubble are often people who did not see real bubbles when they happened. In the real estate boom, the easy profits were on everyone's lips. Same with the Internet bubble 10 years ago.
When I mentioned gold back in 2001 and 2002, when I accumulated it, I got looks from people as if I were crazy.
These days, the crazy looks are gone. But now I often only get answers that gold or silver may be a good investment, but they don't have any themselves. Try it yourself.
Of course, if you've been mouthing off about how great gold and silver are, you probably want to ask people who don't already know your views: They won't think you are trying to "lay your propaganda" on them.
Granted, the public awareness of gold and silver as investments is much, much higher today than in 2001. No one was buying then, and people thought you were crazy if you told them you were. But things haven't changed in that the average person still does not own any.
When everyone you know is talking about how to make "easy money" buying gold or silver, then we may be in a different era. But right now, I think both metals have more room, and most likely much more room, to go.
Good investing,
Chris Weber.
A mixed Asian session - risk off, then back on again
Early G20 communique reports suggest risk may make a comeback
MAJOR HEADLINES – PREVIOUS SESSION
- US Weekly Initial Jobless Claims out at 530k vs. 550k expected and revised 551k prior
- US Weekly Continuing Claims out at 6,138k vs. 6,183k expected and 6,261k prior
- US Aug. Existing Home Sales out at -2.7% m/m vs. +2.1% expected and +7.2% prior
- NZ Aug. Trade Balance out at -NZ$725 mln vs. -NZ$329 mln expected and revised -NZ$175 mln prior
- JP Aug. Corporate Services Price Index out at -3.5% y/y, as expected, vs. -3.4% prior
- SI Aug. Industrial Production out at +12.3% y/y vs. +5.0% expected and revised +17.0% prior
THEMES TO WATCH – UPCOMING SESSION
(All times GMT)- GE GfK Consumer Confidence (0610)
- JP Convenience Store Sales (0700)
- Swiss SNB’s Jordan to speak (0715)
- Sweden Trade Balance (0730)
- Sweden Household Lending (0730)
- EU Euro-zone M3 (0800)
- UK Total Business Investment (0830)
- Swiss KOF Economic Forecast (0930)
- US Durable Goods Orders (1230)
- US Pres Obama to make statement at G20 summit (1230)
- US Final Univ. of Michigan Confidence (1400)
- US New Home Sales (1400)
- Swiss SNB’s Hildebrand to speak (1645)
- EU ECB’s Orphanides to speak (1515)
Markets were impressed by the US initial jobless claims data and this appeared to but a cloud over the USD bulls that had gathered during the Asian session yesterday. However, the euphoria failed to last and the greenback was back in favour as existing home sales data disappointed.
Further dollar support was garnered from the results of the auction of 7-year US Treasury notes which saw bidders more confident once the FOMC was out of the way. The $29 bln issue was heavily oversubscribed (bid/cover ratio at 2.79 times) resulting in a 3.005% yield versus a consensus 3.047%. Weak commodity prices also contributed to the dollar’s bid tone as gold slid back below the 1,000 mark and oil below $66.
Finally, the Fed’s announcement that it was to downsize a couple of its liquidity programmes (TAF and TSLF) in the coming months. While some interpreted the move as a further step towards an exit strategy, others suggested it merely reflected the improving situation in financial markets
GBP was once again the whipping boy in the ring, pressured initially by talk of a “crisis meeting” of economists next week to discuss the reasons for the pound’s decline but then knocked again as BOE Governor Mervyn King said “the fall in the exchange rate will be helpful” in rebalancing the UK economy and noted that the UK banking sector was not in good shape while the economy can only register “small growth” after a very large fall.
Activity in the Asian session was mostly witnessed by the early birds. Stop-loss triggers in GBPJPY saw GBPUSD slice through the 1.60 easily and we were soon visiting near 4-month lows at 1.5920. Elsewhere, the string of better-than-expected New Zealand data came to an end this morning when trade data for August disappointed. While imports were a tad stronger (+3.5% m/m) reflecting improved demand, exports unexpectedly plunged 13.6% m/m despite a better external situation, possibly a victim of the Kiwi’s recent strength.
Some of the first comments from the sidelines of the G20 meeting came from China this morning where it seemed to be talking up the dollar. China’s central bank said the stability of the major reserve currencies still needs to be supported, adding that the US should bear in mind the USD’s reserve currency status when setting policy. US Treasury Secretary Timothy Geithner had mentioned the same theme when saying a strong dollar was still “very important” to the US while expecting the dollar to remain the world’s primary reserve currency. One news bite that does not appear to have grabbed too many headlines came from the new Japanese finance minister reportedly during a meeting with Geithner that he was opposed to intentionally devaluing the JPY, or any other currency for that matter, and during the press conference, when asked whether shifting to a stronger JPY would support domestic demand by cheapening imported goods, he said he is not inclined to shift the currency in that way either, but leave it to market force adding that the public sector should not intervene in the market.
The first reports of the draft communiqué from the G20 summit are suggesting that authorities are not looking at an early withdrawal of stimulus measures to avoid a premature stifling of resurgent economies. The late Asian session is seeing a renewed risk appetite and the USD is retreating from its early morning highs as European players enter stage left. Looking ahead , data-wise German consumer confidence and Swiss KOF economic forecasts are on tap in Europe while the US sees durable goods, new home sales (could they be as bad as existing home sales?) and final Michigan sentiment. The key question whether the current USD rally is yet another minor temporary blip or the start of a more concerted, a deeper correction. We could be in for a volatile session.
Have a great F1 weekend, vroom-vroom from Singapore.
Gold and Crude Oil waiting for their moment of inspiration
The dollar (1% lower) and the stock markets (S&P 2.5% higher) continued their slow grinding move in opposite directions this week thereby continuing to lend support to commodity prices.
The Gold rally headed into its fifth week albeit at a slower pace as the all time high from 2008 at USD 1,032.70 is looming large. On the previous two occasions that we reached and traded above USD 1,000 a major correction followed after a few days.
So far the move has primarily been driven by outside sentiment helped by the weaker dollar. It is therefore safe to say that we will see a major move pretty soon as all the new longs above USD 970 will be looking for a continuation of the rally and the longer it take will begin to worry about setbacks.
In our Q4 outlook for 2009 we have had to hedge our forecast as the current levels are incredible important. A sustained move above USD 1,032.70 on spot would indicate that a new USD 950 to 1,300 range could be in the making over the coming year while a failure and subsequent move back below USD 970 could trigger long liquidation back towards USD 900.
Technically stay long above USD 990 but be careful on a break below USD 970. We would expect the USD 1,032.70 resistance to be firm and would be looking to take profit ahead of this number and then only re-enter on a sustained break above.
The IMF met Friday to discuss its planned sale of 403 tons of gold to finance aid to poor countries. The U.S. Congress have given the go ahead and an agreement will not come as a major surprise to the market.

Some have used inflation fear as a factor behind the recent rally, however this do not hold up looking at the predicted US inflation in five years time as it has shown a decrease over the last month from 3.31% to 2.92%. In conclusion continue to follow the dollar closely as it is the most important market mover as illustrated above.
Crude Oil continues to tread water with most market participant happy to play the current range between USD 68 and 75.00. This past week offered no new clues as to the next move as the black gold just like the yellow variety continued to track movements of the dollar as illustrated by the last five days movement of the two below.

The supply overhang continue to be a worry near term with US supplies of Crude being 14% larger than last year and the distillate stockpiles approaching a 27 year high.
As mentioned earlier we continue to see range trading being the favoured approach with resistance on October Crude at USD 73.15 followed by USD 75.00. Meanwhile support can be found at USD 69.40 followed by USD 68.00. The October futures contract expires next week and November will become front month on Tuesday.
The international freight market receives much attention as it is a good global indicator of trade and economic prosperity. Unfortunately this sector is often only described through the ups and downs of the Baltic Dry index. This index continues to catch a lot attention due to the extreme price movements seen over the last year having collapsed by 94% only to recover strongly earlier this year and now falling again.
This is our new weekly comment about this segment: In general the freight market continues to look depressed, however with significant sparks of green showing up in the clean east tanker market.
In dry bulk the trend setting Capesize vessels carrying mostly iron ore to China see spot rate decreases of more than 36 per cent over the last 4 weeks whereas the smaller vessels seem to hold the ground for the moment.
In the tanker market rates for the big crude carrying VLCC’s keep being depressed with owners barely breaking even on the going spot rates.
However in the east clean tanker market a significant squeeze on vessel availability due to increasing clean storage has firmed the market up very significantly with spot rate increases of up 20 per cent over last week only. Whether this positive trend will spread to the rest of the tanker market and proves sustainable longer term remains to be seen.
Analysis by:
Ole S. Hansen
SILVER VS GOLD THE PAST SEVEN YEARS

A big question for the precious-metals investor is "Gold or silver... which do I choose?"
Our chart of the week might help you pick. It says: Long term, the returns are similar... but holding silver requires a bottle of Tums at your side.
This chart compares silver's performance (black line) versus the performance of gold (blue line) over the past seven years.
Up until a few months ago, silver and gold were both up 200% since 2003. Silver has enjoyed a surge since August to nudge higher in the race. But the major thing to take away is this: Silver goes through much bigger swings than gold. It suffered a 56% downswing in 2008, for instance.
So... the market's answer to the above question is, "Unless you have a strong stomach, keep most of your precious metals portfolio in gold."
– Brian Hunt
Where All the Money You'll Ever Make in Stocks Will Come From
By Dan Ferris, editor, Extreme Value
I'm convinced the return of the king is upon us.
It's often said that cash is king. But for the past generation or so, nobody cared much for the guy. Consumers borrowed as much of him as they could to buy stuff they couldn't afford. Investors avoided him because they wanted to speculate on Internet stocks, condos, and commodities.
But now, more than at any time in the past three decades, investors need to own stocks that consistently pay cash dividends. It's too risky to own the traditional junk most folks typically own.
Everyone seems to have forgotten about them today, but dividends are the main way you make money in stocks over the long term. If you're going to get rich in stocks, you're going to receive lots of dividends, and you're going to reinvest those dividends. Growing rich in stocks over time has meant this for much of the last two centuries.
Referring to a study of the period from 1872 to 2000 in his excellent book, Behavioural Investing, analyst James Montier says, "Over the long term, dividend yield has provided over 50% of the total return to equities!"
Montier's findings also showed that, during the turbulent 1970s, growth and valuation changes produced negative results, but stockholders still made money by collecting cash dividends.
When times got tough, dividends were all you earned from stocks. From 1970 through 1982, the U.S. went through four recessions. Inflation averaged 5% per year. Other similar studies I've seen suggest Montier's data overstates the case slightly, but the point remains: Dividends bailed investors out during the 1970s.
But that's just the payment of cash dividends. It says nothing of the power of reinvested dividends. In The Future for Investors, Wharton professor Jeremy Siegel published an even more astounding finding:
From 1871 to 2003, 97 percent of the total after-inflation accumulation from stocks comes from reinvesting dividends. Only 3 percent comes from capital gains.
Whether it's a 132-year epoch or a turbulent decade during which inflation has investors too scared to buy, the data all point in one unmistakable direction. As financial researcher and investment manager Rob Arnott put it, "Dividends not only dwarf inflation, growth, and changing valuation levels individually, but they also dwarf the combined importance of inflation, growth, and changing valuation levels."
Dividends rule. Over your lifetime, the odds are squarely against any outcome but this: You'll either make a lot of money on reinvested dividends or you won't make much money in stocks.
How can you get started earning dividends and then reinvesting them? Or stated more simply, how can you start getting rich in stocks?
I don't think you can do better than what I've been telling my Extreme Value readers for years: Stick with the world's best businesses with long uninterrupted histories of increasing their dividends. Stick with what I call "World Dominators."
A World Dominator is generally the largest, most powerful company in its industry. It can raise prices to stay ahead of inflation and use its enormous size to keep costs low. Raising prices or being the lowest-cost provider means these World Dominators tend to crush the competition. So they often generate enormous amounts of cash. That cash can support dividends through good times and bad.
Take one of my favorite Dominators, Procter & Gamble. It has raised its dividend every year for 55 years in a row. Or another, Wal-Mart. It has raised its dividend every year of its existence as a public company.
As a giant, World Dominating business like P&G or Wal-Mart matures, its excellent competitive position keeps the cash rolling in while the capital expenditures fall due to slower growth. That cash and share repurchases provide investors with growing dividends and capital appreciation. They sport smallish current dividend yields (usually in the 2%-4% area), but as cash flow increases, a Dominator you buy now will yield 10% in five to seven years.
By the way, Warren Buffett – the world's richest investor – owns both of these stocks... and a bunch of other World Dominators. He gets it. He knows cash is king. And he sticks with companies that generate mountains of it. I recommend you do the same.
Good investing,
Dan Ferris
Forex Market Update
JPY cuts a swath through the market on sustained bond market strength. USD not putting up much of a fight as gold touches new high .
AUDUSD and AUDJPY at odds - which one is "right"? University of Michigan Confidence on tap.
MAJOR HEADLINES – PREVIOUS SESSION
* Japan Q2 GDP adjusted down to 0.6% QoQ from 0.9% QoQ
* China Aug. Producer Price Index fell -7.9% YoY vs. -8.2% in Jul.
* China Aug. Purchasing Price Index fell -11.4% YoY vs. -11.7% in Jul.
* China Aug. Consumer Price Index fell -1.2% YoY in Aug. vs. -1.3% expected and -1.8 % in Jul.
* China Aug. Industrial Production rose 12.3% YoY vs. 11.8% expected and 10.8% in Jul.
* China Aug. Retail Sales rose 15.4% YoY vs. 15.3% expected and 15.2% in Jul.
* China Aug. New Yuan Loans rose to 410B vs. 320B expected and 456B in Jul.
* China Aug Trade Balance rose to $15.7B vs. $13.6B expected and $10.6B in Jul.
* Japan Aug. Consumer Confidence rose to 40.4 vs. 40.2 expected and 39.7 in Jul.
* Sweden Q2 GDP out at +0.2% QoQ vs. 0.0% expected and 0.0% in Q1
* UK Aug. PPI Input/Output out at 2.2%/0.2% vs. 1.0%/0.3% expected
* Canada Jul. New Housing Price Index rose 0.3% MoM vs. -0.1% expected
* US Aug. Import Price Index rose 2.0% MoM vs. 1.0% expected and fell -15.0% YoY vs. -15.9% expected
THEMES TO WATCH – UPCOMING SESSION
(All times GMT)
* Upcoming Economic Calendar Highlights
* US Sep. Preliminary University of Michigan Confidence (1400)
* New Zealand Jul. Retail Sales (Sun 2245)
* New Zealand Aug. REINZ House Sales (Mon 0000)
Market Comments:
China still looking strong
China's fresh data overnight looks very impressive, though it doesn't seem the market takes much impetus from these data releases, though the strength in Chinese equities contributed to sustained strength in other world equity markets. The New Yuan Loans figure for August was up from the July figure, but is still a small fraction of the enormous stimulus unleashed on the Chinese economy in previous months, so the pessimists will be out looking at whether the sharp reduction in credit stimulus shows up in months to come. It's tough to draw a bead on the Chinese economy due to the nature of the calculations of its statistics and wildly diverging reports on its prospects. Whether the housing market is a bubble is a vital question: an article from Reuters today notes that affordability is a significant problem in key markets like Shanghai and Berlin, where mortgage cost about 75% of income (though the article questions the calculation of average income and indicates that ).
So far, China seems to be navigating the demand drop from abroad with aplomb - and must continue to do so for the rosy scenario already priced into markets to continue to play out. Auto sales have surge recently and GM says that the country's auto sales could surpass those in the US this year as China becomes the world's largest auto market. Despite the clear evidence of a credit clampdown by banks over the last couple of months, premier Wen Jiabao promised to keep stimulus measures in place, saying "we cannot and will not change the direction of our policies when the conditions aren't appropriate (since the rebound is "unstable, unbalanced and not yet solid"). Our expectations are for weak external demand in China's export markets over at least the coming year (and the one very weak spot in the Chinese data overnight was the export drop of -23.4% YoY for Aug. vs. -19% expected) - so the question is whether China can continue to weather the external demand shock with internal solutions aimed at infrastructure buildout and consumption growth.
JPY strength
JPY certainly wasn't looking for direction from the revision to Japan's GDP overnight (down) nor the strong Chinese data, as it rallied sharply overnight and into the European session. The JPY still seems to get more pull from moves in other markets. This time around it is likely interest rate spreads that are giving the JPY a push, as it finally responded to the very strong signals at the short end of the curve where interest rates spreads have tightened sharply in favor of the JPY in recent days. If we are to pay attention to rate spreads any longer, in fact, then the likes of especially EURJPY (on the last cycle of dovish ECB comments) and other JPY crosses to a lesser extent have further to sell off in the near term to price in the latest tightening. By the 2-yr. interest rate spread measure, USDJPY looks fairly priced. USDJPY is now nearing critical territory at the 90 level - much below here and the pain begins to become ratchet up for the Japanese economy. Let's see how the new administration responds beyond 90, if that comes to pass.
AUDJPY and AUDUSD - out of synch
Just as yesterday we noted the confusing combination of a weak US dollar and very strong US bond auction results - if the market theme is one of "sell the USD due to fiscal profligacy", then why is demand till robust at the longest end of the curve. Another sign of the divergence in the last leg of the market action is the divergence in the behaviour of the USD and the JPY. The JPY has found intermittent support from the still relatively strong fixed income market, while it has been held back at times by the very strong risk appetite in asset markets and traditional carry trade boost that this gives. Meanwhile, the USD has broken strongly to the downside recently. This divergence is very evident in the comparison of the AUDUSD and AUDJPY pairs shown in today's chart - which tracks AUDUSD and AUDJPY on an indexed basis since mid-2007 and shows the two pairs' rolling 40-day correlation. AUDUSD has touched new highs for the cycle recently, while AUDJPY remains well off its highs for the cycle and has been in a back and forth pattern over the last few weeks. There is no consistent pattern as to which pair is the leading indicator, but we have a hard time imagining that this kind of divergence can continue for long. Either JPY must join the USD in the ranks of the weaklings among the G-10, or the USD needs to find strength. (There is a third scenario of course: AUD volatility spikes very strongly relative to USD and JPY volatility and gets the pairs moving in synch again.) We assume in our setup here that the fourth scenario of continued and sustained divergence in the pairs' moves continuing for more than a few more sessions will not happen.

Looking ahead
As long as the Chinese growth story bulls ahead and asset markets remain robust, it is hard to see what is going to stop this USD sell-off in the near term, even if we fear the market is pricing in far too robust a recovery further out. Is 1.5000 in EURUSD the next big psychological target? Looking to play on further USD weakness, we might ought to turn our eyes on USDCAD after yesterday's fairly compelling bearish reversal, though it did take place within the range... The 1.0800 area in USDCAD has not really held here after yesterday's bearish inverted hammer reversal. If the pair can work its way below the 1.0750 level (0.618 Fibo of the recent rally), it could push lower below the lows for the cycle and perhaps to 1.0450 (target calculated with Fibo extension)
Massive Inflation... Has it already Arrived?
People often mistake inflation with its effects. They think that inflation means “prices going up.” But it doesn’t. Let me explain…
Inflation is when the supply of money expands faster than the growth of goods and services in the economy. When there are too many dollars chasing too few goods and services, prices rise.
So, the rising price of beer, milk, eggs and gasoline is the result of inflation. But that part of the equation doesn’t usually happen right away. And that’s what makes it so dangerous. It is a huge mistake to believe there is no inflation, just because prices aren’t rising.
The inflation has already happened. And it continues. Take a look at the chart below. It represents the U.S. Monetary Base – currency in circulation, plus bank reserves held at the Fed.
Hmm. Looks like inflation to me.

So, by definition, massive inflation has already arrived. The question is: when will the wave of monetary inflation show up in the prices we pay?
“It already has,” says IDE natural resources analyst, Rusty McDougal. “Take a look at the stock market. And look at how the financial companies have soared. That’s where the new money shows up first. It’s only a matter of time before consumer prices start to rise.”
“But what about the other side of the argument?” I asked him. “There are some experts who believe deflation is more of a threat than inflation.”
I pointed out some of the deflationary forces at work. People are saving more and spending less. We’re losing 400,000 jobs a month. Companies have cut their spending. And to top it off, the banks are hording cash and borrowers are reluctant to borrow. Even if the Fed stuffs the banks with cash, the money stagnates if the banks don’t lend it out.
But at some point, the “velocity” of money will increase. Prices will too. And Rusty points out that the banks don’t even have to lend money for the devastating effects of inflation to hit.
“Right now, the Federal Reserve is buying Treasury bonds to finance the deficit. And they are trying to do it undercover, so the public is unaware. The goofs running US economic policy are sacrificing the dollar to keep selling Treasury debts. But something has to give. Mark my words. This will lead to a crisis.”
What the Federal Reserve is doing is monetizing the debt. We are buying our own debt with our own funny money. And the Fed’s balance sheet proves the case. Compared to this time last year, the value of Treasury securities held by the Federal Reserve has increased 187%.
In the short run, this can mop up an oversupply of Treasury debt. In the long run, it’s about as effective as trying to create wealth by writing checks back and forth to your spouse.
Rusty contends that the debts owed by the U.S. government are too astronomical to ever be repaid. This debt must therefore be devalued through inflation. Not an easy trick when billions of foreign eyes are watching.
A trillion here, a trillion there… what’s it really mean?
In the 1960s, during a debate over government spending, Illinois Senator Everett Dirksen famously said, “A billion here, a billion there -- pretty soon, you're talking real money.”
Today, billions and trillions are thrown around so much it’s hard to picture what this amount of money really means any more. Well, picture this…
A trillion seconds is 30,000 years ago. And if you laid a trillion dollar bills end-to-end, it would stretch to the moon and back… 400 TIMES.
Think about that the next time you hear that the U.S. government will spend $1.58 trillion more this year than we bring in.
I’ll take two of whatever he’s having…
Most experienced investors are scratching their heads over the market’s rally from the March lows. What has it been built upon?
CNBC has an answer. They recently interviewed the chief investment strategist for a capital management company. This is a “real rally” he told viewers.
“I think one of the biggest things driving Wall Street right now is the March low, and the only reason we got down there is that we had created the nationalized banks scare.”
“I think we’re really early in this recovery which also tells me we’re really early in the stock market recovery,” he added.
This is the sort of “expert advice” that makes for great comedy on CNBC. The market drop wasn’t caused by fears that the government was going to take control of the banking system. The market started dropping in November 2007.
It was caused by the collapse of the housing market, hundreds of thousands of jobs lost every month, and the global economy teetering on collapse.
And here’s what has fueled the rally:
* “Not as bad as expected” earnings announcements
* Crappy bank stocks
* Investors desperate to rebuild their retirement account
We are not “early” in the stock market recovery. The Dow is up 46% since the March lows. If we recover any faster, it will be an “I” shaped recovery, not a “V” or “W” shaped.
This recovery is built on shaky ground, nothing I would consider a solid base for an extended growth period in the markets. Now is a time to be fearful. It is a time to be protective of your profits.
Speaking of shaky ground… On Monday and Tuesday this week, almost 40% of the share volume on the NYSE was comprised of Citigroup, Bank of America, Fannie Mae, and Freddie Mac.
These are not exactly pillars of financial strength. Fannie and Freddie are bankrupt for all intents. And Citi is still hovering around $5 a share, with shaky prospects. And as we mentioned on Tuesday, the overall volume has been declining for several months. That these four companies make up such a large percentage of the volume is concerning.
So why are they trading so heavily?
One reason is that their low share prices attract uneducated investors. Investors have seen the rise from the March lows and want to get in on the action. And because so many shares of these companies were shorted during the meltdown, investors are now scrambling to cover positions.
When these four companies are the last ones pushing the market higher, it’s time to consider taking some profits to safety.
The latest “this doesn’t sound right” number coming out of China is their estimate for inflation.
The official estimate is that price inflation will be 2% for 2009. Andrew Gordon, our value expert who follows China closely, almost jumped out of his chair reading the report.
“Numbers coming out of China have always been a guessing game,” he said. “But this is outrageous. Prices have fallen six out of the past seven months there. The only way for China to have 2% inflation this year is if they averaged 6-8% inflation from now until December. And that’s impossible”
It would be one thing if the markets took the “official” numbers coming out of China and discounted them like Andrew does. But the markets here pay attention to them. Too much attention.
When China’s Purchasing Manager’s Index (PMI) rose for two months in a row this past March, Wall Street took it as another sign that global growth was bouncing back. It was no coincidence that the U.S. market began to rally about the same time.
Andy suspects a Chinese government bureaucrat concluded you can’t have near 8% growth and price deflation at the same time. So one had to go. Naturally, it was deflation.
Spinning the data is an art form in China. The next time the market here rallies on positive news from over there, be careful.
You can make money betting on China though…
It didn’t take long for the iPhone to become the most popular cell phone in the U.S. A large touch screen, thousands of applications, and the “cool” factor have all driven sales.
So imagine the demand when the iPhone is introduced to China , a market where there are 687 million cell phone users. That’s three times larger than the U.S. market.
Talk about a growth opportunity!
And if the sheer number of potential subscribers isn’t enough to excite you, Apple has another advantage: the Chinese view the iPhone as a status symbol. And according to the Wall Street Journal, they also love phones with touch screens and Internet access, two things the iPhone does very well.
Gurus are falling over themselves to recommend Apple. But this news has already been priced in. To play the iPhone craze, you need to dig a level deeper. Our options expert Ted Peroulakis did just that.
He’s found a relatively unknown company that doesn’t just supply parts for the iPhone, but also sells parts for the Blackberry and other smart phones.
You don’t need to know anything about technology to know that “smart” phones are the future. And the company Ted has identified is perfectly positioned to ride this tidal wave to huge profits.
Good Investing,
Bob Irish
Investment Director
Dollar Lower, Oil Higher, Equities Higher - Wakeup Call
We maintain a buy on dips stance – credit markets still look supported in the short term with HY bonds outperforming IG bonds significantly.
What's going on ?
Theme Comment
· EURUSD broke 1.45, but gold didn’t manage to break the 1006 mark for good. Stocks edged higher in the US session, but Asian markets are down around 1%.
· US Consumer Credit declined a record $21.6B in July (stocks actually rallied intraday on that news), but the Federal debt increased by $111.9B.
· We maintain a buy on dips stance – credit markets still look supported in the short term with HY bonds outperforming IG bonds significantly.
FX
EURUSD Buy dips down to 1.4470 for an extension of rally to 1.4580+.
USDJPY Look to sell rallies to the 92.60-70 area for a re-test of o/n lows near 92.0.
EURJPY Seen pivoting around 134.0. Res 134.50, suppt 133.50.
GBPUSD Seems we have more upside. Buy dips to 1.6470-80, stop below 1.6430 for 1.66.
AUDUSD 0.8580-90 crucial for further gains. Below targets 0.8450 else 0.8670+ beckons.
FX Options
EURUSD Vols traded much higher with 1 mth up 1 vol and risk reversals were bid. Market is looking for 1-2 mth 1.50s so we expect spot to continue climbing.
USDJPY Although front end saw some life, it still seems offered but back end is holding up well.
Should Dollar weakness push spot down towards 9100 we should see bigger jumps in vols.
AUDUSD Gamma turns bid with plenty of buyers in the front end. Risk reversals also saw some aggressive buying under 1wk which should keep spot from offered.
Equities
DAX Buy/Sell at the break of 5501/5456 targeting 5538/5419. S/L below/above 5476/5476.
FTSE Buy/Sell at the break of 4971/4925 targeting 5505/4895. S/L below/above 4955/4938.
S&P500 Buy/Sell at the break of 1027/1020 targeting 1033/1014. S/L below/above 1024/1022.
Futures
Gold Buy at the break of 1008 and target 1022. Stop below 1000.
Silver Buy on dips towards 16.50 and target 16.70. Stop below 16.60.
Oil Buy at the break of 71.80 and target 74. Stop below
Silver, Gas, Oil & Gold Report
Another crazy week in commodities with precious metals and precious metal stocks surging higher on heavy volume, while natural gas and crude oil move lower. Money seems to be rotating out of energy and into precious metals.
Spot Gold Bullion – Weekly Trading Chart
Gold jumped higher today breaking out of its 6 month pennant pattern. If prices can hold into the weekend then I expect the $1000 per ounce to be reached quickly. Also Gold stocks took off like rockets, which are a strong sign that gold will follow through on this breakout. It will be interesting to see what happens from here.

Spot Silver Bullion – Weekly Trading Chart
Silver and silver stocks are shooting higher as well.

Natural Gas – Monthly Trading Chart
Natural gas continues to trade lower. The good news is that the price of natural gas is now at a major support level, which was formed as far back as 1996. The weekly natural gas chart shows much of the same price action that oil had before reversing to the up side in February of this year. I would not be surprised, if we see buyers stepping into natural gas at this level.

Crude Oil – Weekly Trading Chart
Crude oil continues to trade within its bullish wedge pattern. We will be looking for a low risk entry point for oil this month using the daily chart.

Commodity Trading Conclusion:
Precious metals are showing strength while the energy sector continues to have selling pressure. Gold, silver, natural gas and oil look ready to make big moves in the coming weeks and, being positioned on the right side, will generate some massive profits.
Staying focused for low risk entry points is important when volatility and emotions are running high. The excitement/stress for traders this week is very high. With precious metals and precious metal stocks breaking out today on massive volume, it has traders excited or in a panic, if they are not positioned yet. To add more fire to the week, natural gas continues to fall, triggering a panic sell reaction by many investors/traders.
I do like precious metals as a bull play here, but risk is a little higher than I would like. The past couple months precious metals have been jumping around like a yoyo, making it very difficult to find a low risk entry points.
I know many traders are in serious pain, because they bought natural gas a couple months ago, expecting a rally which did not happen. I would like to mention that I am seriously starting to think about scaling into Natural Gas over the next 1-2 months. Natural gas reminds me of a Canadian fund XTR, which I scaled into last February and am now sitting with a very healthy gain, not to mention a 16% dividend. I feel Nat Gas will pay off huge over the long run, but it will take some time to bottom.
Good Investing.
Chris Vermeulen
Subscribe to:
Posts (Atom)