Financial Advisor

Weekly Fundamentals - Weak USD Bolstered Commodities

Commodities generally performed well last week as supported by weakness in the US dollar. Crude oil, shrugging of warnings that high oil prices would dampen global economic growth, soared with the front-month WTI and Brent contracts gaining +1.46% and +1.53% respectively. Nymex gas remained quiet earlier in the week but rallied after DOE/EIA's report showing smaller-than-expected increase in storage. ICE gas prices also rebounded later in the week, snapping a 2-day selloff, as the demand/supply outlook is expected to tighten. Precious metals under our coverage climbed across the board. Gold remained strong and continued making new highs after breaking above 1500. Silver outperformed gold for another week with prices approaching 50. Base metals were the underperformer during the week with the LME metal index losing -2.57%. Macroeconomic concerns remained the major factor weighing on prices.
Being a major event last week, the April FOMC meeting delivered a tone that was modestly more dovish than what had been expected. Policymakers revised lower GDP growth forecasts but raised inflation outlook. Concerning QE2, the Fed 'will complete purchases of $600B of longer-term Treasury securities by the end of the current quarter'. However, the Fed will continue to reinvest maturing securities, both Treasuries and MBS, in order to hold its balance sheet steady after completing the purchases. The aim of doing so is to prevent passive tightening. At the accompanying statement, the reference that exceptionally low levels of interest rates are warranted for an extended period was retained. Chairman Bernanke noted a rate hike will be seen in 2-3 months' time after such language is eventually removed. Our economists expect to see no change in Fed funds rate at least until 1Q12.
USD slumped as the Fed pledged to leave the monetary stance accommodative. The US dollar index, losing -1.43% during the week, fell to as low as 72.83, a level not seen since July 2008, on Friday. Fed's pledge sent USD lower and bolstered commodities, especially gold and silver. Intensified worries over rising inflationary pressures should continue to support the metals.
We will have 3 major central bank meetings in the coming week. The RBA will leave the cash rate unchanged at 4.75%. However, rising inflation is expected to trigger policymakers to resume tightening in the second half of the year. In Europe, both the ECB and the BOE are facing heightened inflationary pressures. After hiking the main refinancing rate by +25 bps in April, we expect the ECB to stand on the sideline in May. Yet, comments from President Trichet are crucial for future monetary outlook. The BOE will once again leave the Bank rate unchanged at 0.5% and the asset-purchase program at 200B pound. While inflation has kept overshooting target, the majority viewed it as temporary. More importantly, most worried that tightening measures would cripple recovery. Divergent opinions among members are expected, though.

Crude Oil

Weakness in USD sent oil prices higher. The front-month contract for WTI crude oil soared to a new 31-month high of 114.18 on Friday before settling at 113.93. The benchmark began its recent uptrend in last September, marking the longest winning streak on record. The DOE/EIA reported a much bigger –than-expected crude stock-build of +6.16 mmb (consensus: +1.60 mmb) in the week ended April 22. The disappointment was quickly overshadowed by draws in gasoline and distillate stockpiles. We were also impressed by the -0.74 mmd decline in Cushing stock. This second consecutive weekly draw supports our view that Cushing stock has begun reversing the stock-builds previous stock-builds as flows from Canada normalize and Midwest refinery margins improve.

Natural Gas

US gas storage increased +31 bcf to 1685 bcf in the week ended April 22. Despite a third consecutive weekly injection, the size was smaller than expected and thus boosted sentiment. Stocks were now -215 bcf below the same period last year and -11 bcf, or -0.6%, lower than the 5-year average of 1696 bcf. Investors were also thrilled as gas inventory fell below the 5-year average for the first time since the week ended February 25. Separately, Baker Hughes reported the number of gas rigs fell for the first time in 4 weeks, by -4 units to 882 units in the week ended April 29.

Precious Metals

Weakness in USD particularly supported the rally in gold and silver. We believe the metals' strength after the FOMC meeting was in part due to heightened inflation expectations. Indeed, while gold's movement is affected by inflation and inflation expectations, it's also affected by central banks' monetary decisions. Fed's pledge to leave monetary policies accommodative intensified inflation expectations in the US. Elsewhere, Eurozone's CPI jumped +2.8% q/q in April. The market forecasts the ECB to leave interest rates unchanged at the May meeting. However, the focus is on the post-meeting press conference as President Trichet might deliver some hawkish comments. In emerging countries, Russia, China and India are accelerating tightening measures to curb inflation. We advise investors to note that tightening outside the US may eventually dampen gold's uptrend. The timing is not in the near- to medium-term, though.
Silver's outperformance over gold has sent the gold/silver ratio below 32, the first time since 1980, on Thursday. The white metal flirted with the psychological level of 50 last week. Recent trading momentum indeed suggests price will eventually reach there. Yet, the risk of correction is at the same time increasing. Ample mine supply remains the weakest link in silver market. Mexico's National Statistics Institute said that silver mine supply climbed +23.4% to 278 K kg due to new mine production and increased production efficiency at existing facilities. World silver mine supply is expected to increase further in 2011, following a +3% y/y rise last year.

Base Metals

The complex fell with the exception of aluminum which climbed +0.82% during the week. In short, the market worried about global economic slowdown which will affect demand for base metals. We believe these worries were overdone and base metal prices should recover once economic data showed improvements in outlook. According to International Copper Study Group (ICSG), preliminary data shows that the refined copper market balance reached a deficit of -20K metric ton in January 2011, compared with a surplus of +86K metric ton the same period last year. In another report released earlier in the April, ICSG forecasts global growth in copper demand to exceed global growth in copper production this year. The annual production deficit is expected increase to 380K metric ton this year, up +52% from 250K metric ton in 2010.


FX Update: Royal distraction can't keep pressure off the USD

With all eyes on holiday and/or the royals’ nuptials in the London, currency moves have been relatively muted, though the USD remains weak. Interesting developments are keeping the Canadian dollar even weaker than its US counterpart at the moment. What gives?
Canada election ahead
Canada goes to the polls this coming Monday. Until very recently, the snap election was expected to simply solidify the existing government’s base and the view on CAD was relatively positive, considering its pro-cylical credentials and exposure to the strong commodities theme, etc. Harper’s Conservatives have even promised further pro-business measures to which the market traditionally responds positively. But now a dark horse party, the NDP, is surging in the polls and has a very different take on the right medicine for the nation’s economy. It is looking to raise taxes on large companies and ratchet social spending higher. While the NDP will not garnet enough support to form a minority government, it is introducing enough uncertainty about the Conservative chances at forming a minority government that CAD has sharply underperformed other pro-cyclical assets and currencies lately. Those looking to fade this development might have a glance at potential downside in AUDCAD in the wake of the election.
Odds and Ends
The True Finns might behave remarkably untrue to their election campaign promises of blocking all efforts aimed at bailing out Portugal in a bid to become a partner in a new coalition government with the largest National Coalition party. Apparently, a softening of the True Finn’s stance may involve a bit of horsetrading as measures aimed at domestic job creation may be offered to the True Finns in exchange for their vote on complicity with an EFSF bailout of Portugal. This political pragmatism is in sharp contrast to the fears generated by the True Finns stance during the election season. As a reminder, a Portuguese bailout would require a unanimous vote from all Eurozone members and the Finnish vote on such a measure would require a majority approval vote by its parliament. Eurozone sovereign debt spreads outside “PIG” have improved over the last two days of trading.
Canada posted an ugly GDP growth figure for February, when the economy actually turned negative for the month. Apparently there is no real takeaway from this data point, as most of it was attributable to lower production from manufacturers, including a handful of outright factory shutdowns for maintenance  in the year’s coldest month. Canadian data has been generally strong of late. Still, there seems to be some hesitancy in jumping into CAD with the upcoming May 2 election.
Bloomberg’s Pesek penned an excellent column on the crisis in Japan and the amazing complacency in the marketplace (Japan’s bond yields, etc.) despite the desperate times the country faces. “Japan is in bizarre economic territory” indeed. Is there ever a trigger moment in the nation’s history when the treasury simply can’t issue more bonds – when will the straw be placed that breaks the debt market’s back in that country? In the meantime, the JPY is able to find support as long as government bonds find support and the waters appear relatively calm. The fat tail lurks out there for Japan’s market and that tail is getting fatter by the day, as Pesek’s column suggests.
Looking ahead
With extremely high leverage in the US economy, there are no sure things in this world, save for the fact that risk is far higher than this market appreciates at the moment. With the end of QE2 approaching in two months now, the clock is running down on this complacent environment.
The Chicago PMI out just now came in slightly below expectations and well below the March data point, but is still very strong at 67.6. This was the third regional survey to disappoint this month and suggests some of the momentum may be coming out of the US manufacturing sector. More confirmation on that possible next week, though the ISM non-manufacturing remains the most important of these surveys considering the dominance of the services sector.
Look out for the University of Michigan final reading for April (likely to be adjusted lower due to acceleration higher in gas prices?). Also remember that the UK is out for a holiday on Monday as well.
Consider being very careful out there as well and have a great weekend.
Economic Data Highlights
  • New Zealand Mar. Trade Balance out at 464M vs. 200M expected and 193M in Feb.
  • Australia Mar. RP Data- Rismark House Price Index rose +0.2% MoM (s.a.) vs. 0.0% in Feb.
  • China Apr. MNI Business Conditions Survey out at 69.28 vs. 69.33 in Mar.
  • China Apr. HSBC Manufacturing PMI out at 51.8 vs. 51.8 in Mar.
  • Germany Mar. Retail Sales out at -2.1% MoM and -3.5% YoY vs. +0.2%/+1.4% expected, respectively and vs. +1.5% YoY in Feb.
  • Norway Apr. Unemployment Rate out at +2.8% as expected and vs. 2.0% in Mar.
  • Sweden Mar. Household Lending out at +7.3% YoY vs. +7.5% in Feb.
  • Sweden Retail Sales out at  -0.8% MoM and +0.7% YoY vs. +0.2%/+2.8% expected, respectively and vs. +2.8% YoY in Feb.
  • EuroZone Apr. EuroZone CPI Estimate out at +2.8% YoY vs. +2.7% expected and +2.6% in Mar.
  • EuroZone Mar. Unemployment Rate out unchanged at 9.9% as expected
  • Switzerland Apr. KOF Swiss Leading Indicator out at 2.29 vs. 2.20 expected and 2.25 in Mar.
  • Canada Feb. GDP out at -0.2% MoM and +2.9% YoY vs. 0.0%/+3.1% expected, respectively and vs. +3.3% YoY in Jan.
  • US Q1 Employment Cost Index out at +0.6% QoQ vs. +0.5% expected and +0.4% in Q4
  • US Mar. Personal Income rose +0.5% MoM vs. +0.4% expected and +0.4% in Feb.
  • US Mar. Personal Spending rose +0.6% MoM vs. 0.5% expected and +0.9% in Feb.
  • US Mar. PCE Core out at +0.1% MoM and +0.9% YoY, both as expected and vs. +0.9% YoY in Feb.
Upcoming Economic Calendar Highlights (all times GMT)
  • US Chicago PMI (1345)
  • US Apr. Final University of Michigan Confidence (1355)
  • US Apr. NAPM Milwaukee (1400)
  • US Fed’s Bernanke to Speak at Fed Conference (1630)
  • China Apr. PMI Manufacturing (Sun 0100)
  • UK Apr. Hometrack Housing Survey (Sun 2301)
  • Australia Apr. AiG Performance of Manufacturing Index (2330)
  • Australia Q1 House Price (Mon 0130)
  • Japan Mar. Labor Cash Earnings (Mon 0130)
  • Japan Apr. Vehicle Sales (Mon 0500)

Oil giant Total wants a bite of the booming solar industry

Total has just announced its intention to acquire 60% of SunPower Corp. for around USD1.38 billion as global demand for solar energy keeps surging. This is a big seal of approval for the whole solar industry and should give other solar stocks more tailwind.
The move by Total signals that major energy companies, such as big oil, want a presence in the renewable energy space. This is also witnessed by Exxon Mobil’s big bet on next-generation biofuels from photosynthetic algae. Total’s acquisition is, indirectly, a friendly tender offer. The move endorses the direction the solar industry has taken the last couple of years and the growth prospects. It is also evidence that valuations are low compared to earnings growth potential and this should boost valuation of other solar stocks in the short-tem.
In our yearly outlook we said solar stocks, due to their relative valuation to wind stocks and their growth prospects, would return at least 30 percent this year. So far this year, the Guggenheim Solar ETF has risen 15.8 percent (see chart below), half way to delivering our target for 2011. Also fourth quarter earnings and sales growth rates were impressive, adding support for the rally in solar stocks.
The industry’s leading solar company, First Solar, will report first quarter earnings on Tuesday which will set the direction the next couple of months. Despite famous short-seller Jim Chanos being out with negative comments about First Solar (he has shorted the stock) and the industry in general, we believe solar stocks have more room as the industry is gradually becoming more competitive due to lower production costs and higher oil prices. 
Source: Bloomberg 

FX Update: JPY and CHF falter ahead of FOMC

The bond market finally topped out and reversed course ahead of the FOMC meeting today, a pattern that was mimicked by the Japanese Yen and Swiss Franc. What gives? Also – more on what to expect from FOMC today.
Being franc
Very interesting moves in the Swiss franc today, with no apparent driver for the action other than the obviously large anticipation surrounding the FOMC announcement and the recent nervousness in sovereign debt spreads in Europe. CHF has tended to the strong side of late on the strength in government bonds, which help it out from a yield comparison perspective, but also on the spiking spreads in European sovereign debt, as the franc has often served as a safe haven from Euro-stress via the EURCHF cross. Today, as Greek 2-yr. yields spiked anew to above 25% (though important to note there was no contagion evident in the Spanish/German spread today), EURCHF spiked all the way down to 1.2750 before launching a sharp recovery most of the way back to 1.2900 as of this writing. This is an interesting reversal from a technical point of view and other crosses like GBPCHF reversed from interesting level as well.
Chart: USDCHF
The trend followers have been milking the USDCHF downtrend for all it is worth lately, with an additional blow-off rally today in CHF strength ahead of the FOMC meeting. But the later European session today saw a huge bout of profit taking on no evident news flow (though there was a top out and reverse intraday in the bond market that coincided with the move), creating a reversal pattern from interesting levels in EURCHF (just ahead of 1-month lows) and GBPCHF (very close to the recent post-Japan earthquake all time low). With such an important event risk today, it will be interesting to see whether major CHF crosses are trying to scratch out a turnaround here.

Odds and ends
The S&P bond ratings agency found an easy target in Japan, downgrading its  AA- credit outlook to negative from stable on fears. The JPY weakened sharply on this news after pushing to its strongest level in a month overnight. It is no coincidence that US bonds peaked out today and reversed rather sharply ahead of the open of equity trading today and the movement in bond markets in the wake of the FOMC will be far more important than any fallout from this announcement. To the upside, that 82.50 area is a key pivot zone for the USDJPY and the 200-day moving average is a bit higher at 83.20.
Overnight, higher than expected Australia CPI data boosted the AUDUSD above 1.08 for the first time in modern memory. Interesting that this latest sharp leg up is taking place ahead of a critical event risk and with some of the important materials stocks (particularly BHP Billiton) and related commodities not having a banner day today. AUD crosses certainly would appear to have some of the highest volatility potential in the wake of today’s FOMC proceedings.
The US Durable Goods Orders numbers were better than they appeared on the surface, with the ex Transportation number coming in at +1.3% MoM, though this was from a sharply upwardly revised Feb. number (revised up to +0.6% from -0.6%) And the ex-aircraft, ex-defense capital goods orders were also strong considering the very sharply upwardly revised Feb data (from -1.3% to +0.5%)
Looking ahead
We’ll have a quick and dirty analysis of the new FOMC statement when it is released today (note the earlier release time of 1630 GMT) and then we’ll discuss Bernanke’s performance in the immediate wake of his first press conference, which is scheduled to start at 1815. Here’s a good Bloomberg article that gives a good idea of what the consensus is looking for from this meeting.
The Bloomberg article shows the debate on when the Fed will phase out the “extended period” phrase on how long it plans to keep rate this low in the September to November time frame. That being the case, it is easy to see why the USD is weak in a world of 46-dollar silver and 125-dollar crude. In this environment, it would appear that the only thing that could disrupt the dollar’s decline are signs of weakening economies around the world (which would challenge the “buy everything else trade”), a strong tilt in the hawkish direction for the Fed provided by signs of a growing and more hawkish minority, or anything else that might trigger a bout of risk aversion.
At some point between now and the end of June, the market will at least have to take a break from its ever upward spiral to recognize the import of the QE2 program drawing to a close. As endless analysts have been point out – the S&P (and global risk assets in general, we might add) are highly correlated with the size of the Fed’s balance sheet. While everyone can talk up the likelihood of QE3, it’s not here yet and we have a known date for at least a pause in the balance sheet growth.
In the meantime, the most plausible source of surprise from today’s FOMC proceedings are, on the minor side, how the Fed words its inflation statement (expectations are for the “transitory” language, but the Fed might give itself an out by indicating what conditions would cause it to change its views on inflation) and on the more interesting side, how many dissenting votes we get and what those dissenters will say. Relative to the consensus expectations, there are at least four known FOMC voters that are not happy (particularly Fisher and Plosser, but also Bullard and perhaps Kocherlakota) and we have a hard time seeing all of them signing off without a protest on the dovish cabal’s musings today.
Economic Data Highlights
  • Japan Mar. Retail Trade out at -7.8% MoM and -8.5% YoY vs. -5.3%/-6.1% expected, respectively and +0.1% YoY in Feb.
  • Japan Apr. Small Business Confidence out at 36.1 vs. 49.5 in Mar.
  • New Zealand Apr. NBNZ Business Confidence out at 14.2 vs. -8.7 in Mar.
  • Australia Q1 Consumer Prices out at +1.6% QoQ and +3.3% YoY vs. +1.2%/+3.0% expected, respectively nd vs. +2.7 YoY in Q4
  • Australia Q1 RBA Trimmed Mean Prices out at +0.9% QoQ and +2.3% YoY vs. +0.7%/+2.1% expected, respectively and vs. +2.2% YoY in Q4
  • UK Q1 GDP out at +0.5% QoQ and +1.8% YoY, both as expected and vs. 1.5% YoY in Q4
  • UK Feb. Index of Services rose +0.6% MoM vs. +0.2% expected
  • EuroZone Feb. Industrial New Orders rose +21.3% YoY vs. +21.8% expected and +21.9% in Jan.
  • Germany Apr. CPI out at +0.2% MoM and +2.4% YoY, both as expected and vs. +2.1% YoY in Mar.
  • US Mar. Durable Goods Orders out at +2.5% MoM and ex Transportation at +1.3%, vs. +2.3%/+1.9% expected, respectively
  • US Mar. Capital Goods Orders ex-Defense and ex-Aircraft out at +3.7% MoM vs. +3.8% expected
  • Canada Feb. Teranet/National Bank Home Price Index rose +0.1% MoM and +3.8% YoY vs. +0.2%/+4.1%  expected, respectively and vs. +3.9% YoY in Jan.
Upcoming Economic Calendar Highlights (all times GMT)
  • US DoE Weekly Crude Oil and Product Inventories (1430)
  • US FOM Rate Decision and Monetary Policy Statement release (1630)
  • US Fed’s Bernanke to Speak at Fed Press Conference (1815)
  • New Zealand RBNZ Cash Rate announcement (2100)
  • UK Apr. GfK Consumer Confidence Survey (2301)
  • Japan Apr. Markit/JMMA Manufacturing PMI (2315)
  • Japan Mar. Overall Household Spending (2330)
  • Japan Mar. Jobless Rate (2330)
  • Japan Mar. National CPI (2330)
  • Japan Mar. Industrial Production (2350)
  • Japan Mar. Housing Starts/Construction Orders (0500)

Helicopter Ben rides again

Fed Chairman Bernanke practically stood up and waved a green flag for the markets and the everything up vs. the greenback trade. A look at today's gold chart or virtually any other instrument priced in dollars shows us what we should think of Helicopter Ben's performance at the press conference today.
Chart: Spot Gold (substiciute with ANYTHING/USD for similar results)

Spot gold prices rose as much as 10 dollars above the recent record in today's trade after today's FOMC statement completely conformed with dovish consensus and after Bernanke's "press conference" failed to generate any tough questions or interesting answers. It was an almost surreal sight to watch the Fed chairman pontificate on Fed policies eventually creating a strong USD and the lack of any threat from "transitory" inflation while virtually all global market participants ran screaming for the USD exit on the chairman's complete lack of credibility. It was almost funny, if it wasn't also very scary. This is the most powerful position in the world, let us not forget.
The next bend in the road is the actual end of QE2 at the end of June and what kind of hiccup it might cause in the ever upward spiral for virtually everything. When QE2 ends, it does represent a factual tightening, even if the markets will still have to fret the part of the FOMC statement that reads "The Committee will regularly view the size and composition of its securities holdings in light of incoming information and is prepared to adjust those holdings as needed to best foster maximum employment and price stability." If US consumers are paying five dollars per gallon of gas by then, will politicians finally wake up and smell the coffee of opportunity? So far, mainstream US politicians appear worse than clueless. In the meantime, the odds for Ron Paul's and every other libertarian's  success are rising with every word out of Bernanke's mouth.

EURUSD runs into topside ceiling resistance

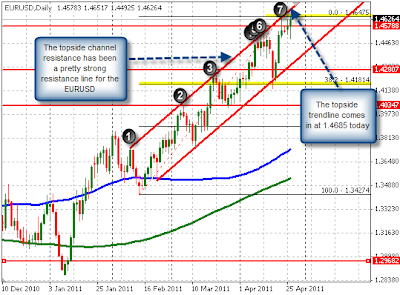
The EURUSD extended up toward the days highs, and the highs from April 21st (at 1.4648) and found willing sellers. As the price was reaching the level, headlines from ECBs Gonzalez-Paramo saying the “rate hike in April was not the start of a series of hikes” helped take some of the upward momentum away from the pair and thwarted the efforts to extend higher - for the time being at least. Downside support comes in against the 100 bar MA on the 5 minute chart (at 1.4596) and the 38.2% of the days range at the 1.4591 level. A move below these levels should solicit another move lower for the pair today.
 Overall, the bias is still bullish with the price failing on the break below the 100 hour MA earlier today.  However, the bulls have to be cautious given the ceiling. On the daily chart (see below), the price has channel trendline resistance at the  1.4685 area. This would be the target on a break of the ceiling at the 1.4651 area. The channel has provided good support and resistance levels for the pair.
 Despite the bullishness, I get the feeling that despite the dollar weakness, Trichet and Co. at the ECB are scared of a too strong EURO. The currency is elevated against the GBP and  USD, in the middle of a  6 month range against the surging CHF and in the top 1/3 of the recent range against the JPY.  So although inflation is elevated, the currencies relative strength should act as a slowing mechanism for the region.  Trichet would like slower growth to keep inflation contained but at the same time, I suspect he is a little concerned about growth (although he won’t admit it).

Written  by Greg Michalowski. 

FX Update: Market nervously eyes FOMC mid-week

With most of Europe still out on holiday, spiking markets on thin volumes elsewhere suggest plenty of nervousness heading into this Wednesday’s FOMC meeting. What are the implications of the FOMC anticipation for this week’s action?
CAD a bit out of whack
The Canadian dollar has not been a very enthusiastic participant in the rally against the USD over the last couple of sessions, showing signs of hesitation despite very supportive external factors recently (massive rebound in energy prices, pro-risk trades rising, etc.). A plausible reason for the market’s caution here is the upcoming Canadian general election, set for Monday, May 2. The consensus is that Brian Harper’s conservatives will emerge on the other side slightly stronger on the other side, with a stronger, if still minority, government. That being the case, and therefore with little prospect for any change of policy direction from a new government in the near future, we would suggest that politics is actually little cause for pause here and that the more dominant factor for Canada is its very large economic exposure to its neighbor to the south. Still, BoC expectations have moved wider against those for the Fed recently and last Thursday’s bounce in USDCAD will need to find other sources of support than Canadian political uncertainty to see any sustainable follow-through higher.
Chinese reserves
 There has been a lot of noise last week over the weekend on the issue of China’s ballooning FX reserves, which increased almost $200 billion in the first three months of this year. This article from Zero Hedge is a good example of the ongoing discussion on the issue. The critical point is, as the article states, how the reserves are created in the first place – through global imbalances and China’s unwillingness over the years to allow its currency to float properly. To this we would pose the question: how much of those reserves will be needed to pay for the fall-out of the coming property bubble implosion in China and what will that development mean for the market’s current rosy view of the global economy’s prospects?
Chart: GBPUSD vs. interest rate spreads
We saw a key technical break higher in GBPUSD last week, a break that is not supported by interest rate spreads, which have normally been quite tightly correlated with the action in the spot market. Is this a sign of inefficiency and the market too eager to sell the USD relative to the pound, which is struggling under a similar set of circumstances, or does it simply represent a tip of the hat to UK fiscal austerity while the USD is foundering on fears that QE3 is only a thousand point dip in the Dow away from materializing in the months ahead? This week is likely to provide an answer.
Looking ahead
We still have more than a little cognitive dissonance at the moment across markets – precious metals are spiking around almost out of control, supposed on the perils of owning fiat currencies. (We have discussed the possibility that the last bout of aggravated volatility in silver in particular may have something to do with the combination of a long holiday weekend, the expiry of May options on Tuesday, the day ahead of a critical FOMC meeting. See more on silver and gold market behavior in our post from last Thursday. The silver move went increasingly parabolic overnight, which raises the odds of a near term exhaustion for a time. The move in Asian hours was attributed to a move by the Shanghai Gold Exchange to hike margins on silver. But we digress…). Equities can find nothing but upside all over the world even as the market frets the demise of the world’s reserve currency, as if such a development isn’t the least cause for alarm (nor apparently is there any alarm at the moment over the events in Syria or the renewed rise in commodity prices like crude oil, food, etc., which are increasing more rapidly than the USD is decreasing.)
Most jarringly, we have very strong US and European bond markets at the same time as we are seeing a spike in fears of US fiscal and central bank credibility. Something simply does not fit here. It seems we are headed, at least in the near term, for an important test of what appears to be a rather crowded short USD trade with this Wednesday’s FOMC meeting and series of US treasury auctions (Tue-Thu, with $35 billion of 2-year notes on the block tomorrow followed by 5-year and 7-year auctions on Wednesday and Thursday, respectively). The demand levels - particularly foreign - at the auctions will be very interesting to watch in light of the recent fall in US yields from close to their recent peaks. The nagging aspect of these auctions is, of course, the presence of the Fed and we won’t have a better picture of real market demand until the July auctions, assuming QE2 expires as announced at the end of June. Still, the Fed doesn’t control the German Bund market or other major sovereign bond markets,  which one case use as coincident indicators here.
Chart: USDJPY
The same level that was important for USDJPY as it descended from on high lately, the 55-day moving average (and daily Ichimoku cloud level at the time, though now it is much lower) around 82.50 is now influential as a resistance level. This week will be a critical one for USDJPY considering the potential for US interest rate volatility on the new FOMC monetary policy statement/Bernanke press conference and huge US treasury auctions Tuesday through Thursday.
Another critical focus this week is the behavior in intra-European sovereign risk spreads, as last week left us hanging a bit, with signs of some contagion as the spiraling Greek and Portuguese situation spread to a degree to Spanish debt spreads.
Be careful out there – this week is likely to see a further acceleration of volatility.
Economic Data Highlights
  • Japan Mar. Corporate Service Price Index out at -1.2% YoY as expected and vs. -1.1% in Fe.
  • Japan Mar. Supermarket Sales rose +0.3% YoY vs. +0.6% in Feb.
Upcoming Economic Calendar Highlights (all times GMT)
  • US Mar. New Home Sales (1400)
  • US Apr. Dallas Fed Manufacturing (1430)
  • Australia Feb. Conference Board Leading Indicator (0000)


Where next for Gold-Silver and the SP 500 Indexes?

The market action in both the precious metals complex and the equities markets has been moving in clearly defined Fibonacci and Elliott Wave patterns for quite some time now. All of the recent peaks and valleys in both areas can be clearly demarcated with Fibonacci retracements and crowd behavioral patterns both in advance and in hindsight. I’ve written about this phenomenon numerous times publicly and every week for my subscribers as well.
The Gold and Silver movements I outlined a few months ago well in advance of the current bull moves. I had suggested we would see 1525-1550 on Gold at the next interim peak back in late January from the 1310 lows. So far we have hit $1508 and near term $1518 is likely before a pullback to the 1480 ranges. Silver has run up to my 45-47 window that I forecasted back when Silver was in the mid $26 ranges. The question is then, what happens next?
Back in August of 2009 I forecasted that we were about to enter a very bullish five year window for the precious metals, and this is based on my theory of a 13 fibonacci year bull market that began in 2001. Crowds move in reliable patterns and my opinion is the movement we are seeing now is the biggest of the 13 year bull because there is “Crowd recognition”. Recall the huge bull market in tech stocks that began in 1986 and ended 13 years later in 1999 with a massive spike to 5000 on the NASDAQ. The final five years were the best for investors before the crash.
Looking at the current precious metals bull market, we are in year 10 now and it’s like 1997 in the Tech stocks. The best is still yet to come, but there will be peaks and valleys along the way as the Bull knocks everyone off the whole way up. Most recently at $1310 in January and only a few weeks ago at $1382 for instance. When I wrote the August 2009 article, gold was around $900 per ounce, and now it’s $1508. In August of 2010 I then forecasted that Silver was about to start a massive run from $19 per ounce, and since then we have rallied to near $47 in just 8-9 months. Silver is poor man’s gold, and my theory really was simply that investors as a herd would view Silver as “cheap” and rush to buy it relative to Gold which would be viewed as “expensive”. The bottom line is intermediately we are getting close to short term tops in both Silver and Gold, and corrections will ensue… but those will again be buying opportunities.
Below are my latest views on Gold and the near term direction:
The Equities markets are also in a multi-year bull market and in the most bullish of the phase as well. We began in March of 2009 and ran up for 13 Fibonacci months to April 2010 where I forecasted an interim top. Since then, we bottomed in July of 2010 in a wave 2 correction that was a 38% Fibonacci retracement of the 13 month rally. The rally to the 1343 highs was only wave 1 of a new 5 wave structure to the upside. The recent correction that surrounded the Japanese Earthquake was another wave 2 down in sentiment, only to be followed by a powerful rally of almost 100 points on the SP 500 index. This type of “shrugging off of bad news” reaction is typical of powerful major 3rd waves in Elliott Wave terms.
The most recent action bottomed at 1295 on the SP 500 and that was minor 2 down, and now what you will see if I’m right is a huge move to over 1400 on the SP 500 as the 3rd wave of this recent structure off the 1240 futures lows of March, begins to take hold. Strap on your seatbelts because this market is going to blast past 1400 and on to 1500 this year. You will also see the NASDAQ lead the charge and make a power move into the 3000’s as well.

Taking a stab at silver and gold technicals

What are the technicals of a market that is trying to go straight up? Here we are talking about silver, of course, a market squarely in the crosshairs as April has already seen the largest “monthly” gain in the metal since…the Hunt brothers blowout. We also have a look at the more civilized gold market and its behavior.
It’s tempting to look at the weekly chart of silver below and decide that we have entered into a parabolic market where the price ramps by an ever increasing amount every day.
But as any equity trader looking at a longer term equity index chart knows, it’s important at some point to move to a logarithmic price axis once price moves begin to be measured in multiples of the starting price. A simple switch to a logarithmic price axis as shown below still leaves us in awe of the recent price move, but it appears far more modest.
What are the technicals of straight up?
Technical analysis breaks down to some degree when you have a market like silver has been lately, in  which seems to charge higher day in and day out with almost no ebb and flow that provides many of the anchor points for traditional technical analysis, like support and resistance lines, etc... Also, most “time window” types of analyses (stochastics, RSI, etc.) can break down when the move extends beyond a certain number of bars and the concept of oversold and overbought can become a bit trite when the action has taken the price several times the daily trading range above some arbitrary overbought/overold indicator that is meant to suggest an extreme.
There are a couple of ways to approach a viciously trending market in search of support and resistance or other signs that might indicate when the trend may be playing itself out. One simple way is to look for cyclical patterns and momentum patterns from the past to see how these have played out.
As we can see from the weekly spot silver chart displayed below, within the overall tremendous bull market in silver that has seen prices advance over 1000% from 2002 levels, there have been four bull markets (the last two are really one overall move) within the overall secular bull trend that account for the entire advance in the price of the metal over the last eight years. 
The seasons aren’t what they used to be
It is very interesting to note a couple of things about the patterns in this market: first, cyclically/seasonally, we immediately notice that the first three bull markets all established important new 200-day highs in the first or second week of November and last until anywhere from late March to early May – a move connected perhaps to the seasonal gold cycle and perhaps the Indian wedding season, where heavy buying traditionally starts in the late fall. Unfortunately, this time around, the critical new high that initiated the bull market was posted in early September – a timing suspiciously coinciding with the US Bernanke led Fed hinting at the coming of the QE2 money printing scheme in late August. Indeed, the precious metals markets these days seem to have little to do with the old seasonal factors and more to do with the entire theme of fiat currency credibility and whether the US Fed will succeed in destroying the US currency with the printing press.
Technical behavior most interesting
Beyond the seasonal argument and any possible fundamental drivers out there in the ether, there is also a technical behavior that is quite specific to silver – its tendency to accelerate beyond the established trend-line at some point, a development that quickly proves destabilizing and then eventually resolves quickly into a rather climactic sell-off and long period of consolidation. The acceleration tendency was certainly there in all of the first three bull markets, as the red circles show – particularly in the early 2006 market, and in two fits and starts in the big bull run in late 2007 to early 2008.
This time around, silver has established the steepest trendline yet compared with any of the previous bull markets, and in fact, even on a logarithmic price chart, the second leg (marked number 5) has proven the steepest. This last week of action has seen the largest deviation from the trendline – a development that bears watching in coming weeks for signs of further acceleration – if the chart quickly reverts to the trendline and stays “well behaved” relative to the established trend, the trend may continue even longer, but if we get another bar or two that sees a dramatic price acceleration beyond the trend-line, this would represent a “parabolic” move and likely pre-announce the end of the rally within just a few weeks of that development.
The key thing to note about parabolic moves is that while compressed in time, the price action can become almost unimaginably volatile, so (please, this is just an example/imagined scenario) the brave soul that shorts silver two weeks from now at a price of 73 dollars an ounce might be right in August, when silver trades at 53 dollars – but that won’t help much if he got stopped out at 93 dollars in late May… The Hunt brothers spike in early 1980 saw the price of silver do a similar dance – but it was quite a jig as the price doubled in less than four weeks from 25 to 50 dollars and then traded at 20 dollars about eight weeks after the peak.
Next week critical for precious metals
Another key note to keep in mind is that May silver options expire this coming Tuesday, 26 April (and the April silver contract stops trading the following day). One has to imagine that there are some enormous winners and losers holding these contracts, those who bought and sold at strikes that were unimaginably far away a month or more ago. In the meantime, there are endless reports of tightness in the physical silver market and emotion is running high. To top things off, the London Bullion Market Association, a huge presence in the physical market, is out for Easter holiday tomorrow and Monday.
If that is not enough, we also have the FOMC meeting late Wednesday and further UK disruptions from the royal wedding in the UK next Friday and the following Monday. We have to imagine the price next week at this time will be … anywhere but where it is now?
What about gold?
Gold has been a far more staid market than silver, a bit less prone to the blowout rallies and subsequent blowout retreats, but the metal has also seen an enormous 350% advance since early 2005. 
Chart source: Bloomberg
We have drawn a linear regression to show that gold may be getting a bit expensive locally within the overall trend as it approaches the 1 standard deviation line on the upside. This assumes we don’t kick into a high gear scenario with panic surrounding the US dollar as QE2 expires at the end of June and the market gauges whether the Fed ultimately prepares the way for QE3. The stakes for all financial markets, especially precious metals, will be very high in the coming several months, not only due to the US central bank and the dire US fiscal straits, but also as the EU grapples with a refresh of its EFSF bailout mechanism at the June EU summit and all of the implications this could have for the sovereign debt issue there.
Have a wonderful weekend and a wonderful holiday if you are taking one.


FX Update: US dollar dead cat?

The USD was pummeled once again on a fresh batch of positive earnings reports from US companies and suggestions that Bernanke and Co. will continue to lay low as US moves toward budget austerity. But this morning we are seeing a bit of a bounce in the greenback – just a dead cat?
Positive earnings news – most notably from Apple, which smashed earnings estimates – late in the US sent the greenback on fresh journey southward as the news encouraged the short USD/long everything else trade. Silver took out fresh milestones overnight (news of Goldman declaring the metal hard to borrow, swirling rumors about JPM’s silver derivatives book and expiration of the CME futures/options contracts on Tuesday of next week have that market squarely in the spotlight), crude oil snapped back,. Interestingly (and very jarring for the positive risk appetite elsewhere) bonds and bunds are rallying strongly again this morning, even before the still fairly weak US jobless claims number, which only served to accelerate the development. This has USDJPY through key support and challenges the technical picture in that pair, now that the sell-off has taken out key objectives.
Euro status, please
You certainly couldn’t tell it by looking at a EURUSD chart coming into today’s US session, but spreads on Portuguese and Greek debt widened precipitously today despite the recent successful Spanish debt auction and Greek authorities’ attempts to go after people accused of fomenting false rumors about a Greek default. Greek 2-year yields are at an absurd 23%. March and June 2012 Euribor contracts have rallied strongly today as the market is beginning to question the boldness of its expectations for ECB tightening. As well, the spread between German and Spanish/Italian debt also widened close to where it was at its widest levels in the immediate wake of this last weekend’s Finnish election. So, while risk appetite got the best of EURUSD from late last night, other fundamental pressures have actually eroded much of the support for the rally. We’d need to see a powerful reversal here and close below 1.4520 to start any technical discussion on the prospects for an end to the current rally, however. Elsewhere, it’s a bit easier to see the Euro-negative developments. In EURGBP, for example, the sell-off has been rejoined and the pair looks to be carving out a rather clear top for now.
Chart: EURJPY
EURJPY and German Bunds have been relatively correlated (negatively) over the last week or so, once Bunds kicked off a dramatic rally that coincided with a sharp EURJPY consolidation. Now we are seeing a follow up move in Bunds higher while EURJPY seems a bit hesitant to renew the sell-off – will the two markets maintain their relationship? We’ve already crossed below key support in the key USDJPY pair.

Odds and ends
Australia’s Kevin Rudd said that Australia won’t “manipulate” its currency and said that other countries that do would “pay a price”. This statement despite the Aussie’s incredible recent run suggests that the currency is given the green light for further gains as long as the Everything Up vs. the USD trade spiral continues.
UK Retail Sales ex Auto Fuel rose +0.9% MoM, though this was from a downward revised Feb. data point. Still, the resilience in consumption flouts generally negative expectations for the UK economy and the negative Euro news flow supported GBP strongly in the crosses, with EURGBP reversing most of yesterday’s rally and GBPUSD shooting to its highest level since late 2009.
On the headline, Canada’s Feb. Retail Sales figure was strong, but the margin of the expectations beat came matched the size of Jan’s downward revision, weather was a huge factor in Canada this winter, and why is Canada so slow to release its Retail Sales data in the first place? Shortly put – it’s tough to react to ancient history.
The German IFO is still very strong by historic standards, but has edged ever so gently lower, led by the Expectations index, which dropped to 104.7, below expectations and at the lowest level since last September. The Current Assessment index for April set another record high.
US Jobless claims dipped this week, but not enough to suggest that last week’s very poor reading is a one-off fluke. With two 400k+ readings now, the moving averages are beginning to level out, threatening the picture of an improving job market. This has not been the case in many of the other key economic surveys with employment components, however, so we still need to give the indicator a few more weeks and look around for corroborating evidence before drawing any conclusions.
Looking ahead
Thin trading days ahead with the Easter holiday tomorrow and for many European countries on Monday as well. In such market conditions, we can only look at the current melt-up and take a “wait and see” stance. The only consolation for those looking for a USD bottom here is that most USD pairs are showing some divergent momentum here (new lows in the USD while momentum indicators are not at new local lows) but in this market, one would certainly like to see a confirming reversal in place before acting.
Effectively, we only have one real trading left until next Wednesday’s FOMC meeting. All eyes will be on Bernanke’s press conference after the “rate decision” and release of the new monetary policy statement. Will it reconfirm the USD downtrend or serve as a trigger for at least a respectable consolidation on a sell-the-rumor, buy the fact reaction to whatever the FOMC and Helicopter Ben have to say?
Be careful out there, and have a great holiday, those of you who are fortunate enough to be taking one here.
Economic Data Highlights
  • New Zealand Apr. Consumer Confidence out at 010.4 vs. 101.4 in Mar.
  • Australia Q1 NAB Business Confidence rose to 11 vs. 5 in Q4
  • Australia Q1 Producer Price Index out at +1.2% QoQ and +2.9% YoY vs. +1.0%/+2.7% expected, respectively and vs. +2.7% YoY in Q4
  • New Zealand Credit Card Spending out at -1.6% MoM and +1.5% YoY vs. +5.2% YoY in Feb.
  • Germany Apr. IFO Business Climate out at 110.4 vs. 110.5 expected and 111.1 in Mar.
  • UK Retail Sales ex Auto Fuel out at +0.2% MoM and +0.9% YoY vs. -0.4%/+0.8% expected, respectively and vs. +0.8% YoY in Feb.
  • Canada Feb. Retail Sales out at +0.4% MoM and +0.7% MoM less Autos vs. +0.5%/+0.5% expected, respectively.
  • US Weekly Initial Jobless Claims out at 403k vs. 390k expected and 416k last week
  • US Weekly Continuing Claims out at 3695k vs. 3675k expected and 3702k last week
  • US Weekly Bloomberg Consumer Comfort survey out at -42.6 vs. -43.6 expected and -43.0 last week
Upcoming Economic Calendar Highlights
  • US Feb. House Price Index (1400)
  • US Mar. Philadelphia Fed Survey (1400)
  • Japan Mar. Corporate Service Price Index (2350)
  • Japan Mar. Supermarket Sales (0500)

Daily Report: Dollar Sold off On Risk Appetite, Breaks 2009 Low

Dollar is sold off sharply across the board on rising commodities as well as return of risk appetite. Dollar index breaks through key support level of 74.19 made in 2009 and is possibly heading towards 2008 all time low of 70.70. Gold jumps to new record high of 1509.5 on inflation expectations while crude oil is also back trading above 112 level. Surge in commodity prices takes Aussie and Loonie higher, with AUD/USD making another record high above 1.077, as also boosted by strong PPI data. USD/CAD also extends recent decline and is trading below 0.95 level. European majors are also firm against dollar. One development to note is that USD/JPY also breaks through 82 level while other yen crosses are relatively steady.
Investors sentiments were lifted by strong US earnings including Apple, which second quarter profit almost doubled. Nasdaq had the biggest daily rise in six months while DOW closed at the highest level since June 5 2008. Technically, DOW's break of 12450 resistance indicates that recent uptrend is not over yet. And judging from current momentum, DOW would likely take out long term projection level of 6469 to 11258 from 9614 at 12573. The development indeed favors a test on 13000 psychological level. Such strength in risk appetite will likely push dollar further lower and give continuous boost to Aussie. 
Dollar index's break of 74.19 support is relatively easy. Outlook remains bearish as long as 75.81 resistance holds even in case of rebound. Current decline should extend to next cluster projection level of 61.8% projection of 88.70 to 75.63 from 81.31 at 73.27, 100% projection of 89.62 to 74.19 from 88.70 at 73.27. This 73.27 level will be closely watched on possibly of rebound. But based on accelerating downside momentum, it seems not likely. Sustained trading below 73 will pave the way to a new all time low below 70.70 made in 2008. 

On the data front, Australian PPI rose 1.2% qoq in Q1, above expectation of 1.0%. German IFO bushiness climate will be a feature in April and is expected to drop slightly to 110.5. UK retail sales is expected to drop -0.5% mom in March. Canada retail sales are expected to rise 0.5% mom in February. US initial jobless claims, house price index, leading indicators, Philly Fed survey will also be released.

Critical season for wheat

Today we have a look at US wheat prices, which have vastly underperformed soybeans and corn over the last few months and whether it is time for wheat prices to shine, absolutely and/or relatively.
The huge rallies in grain prices over the last year or so have caught plenty of attention, not only from farmers and commodities traders, but also geopolitically, as some blame the spike in food prices for providing a critical trigger in popular sentiment feeding into the unrest and revolutions across the Middle East and North Africa. Of the three main grains (soy, corn and wheat) wheat prices have rallied the least over the last several months - even if wheat prices are relatively expensive versus historic norms. That's more than a bit surprising, after last year's terrible heat wave in Russia disrupted production there, China has had issues with its wheat crop and now Australia's wheat crop is once again challenged by dry weather. And the biggest supply pinch yet may be on the way in the US, which is the world's largest exporter.
So why the wheat underperformance? Here a number of factors that look at why wheat is priced where it is and a few factors that are supportive of upside for wheat prices (at least the fundamental reasons - there is a financial market component to commodities these days that was less present not so many years ago. The entire Fed money printing/commodity rally theme of late is a huge background phenomenon that could easily prove as influential as the fundamental situation we discuss here.), both in absolute terms or in comparison with the other major grains, particularly corn:
Why wheat is relatively cheap:
 "Wheat" in this case means CBOT wheat, which is soft red winter wheat - the hard red winter wheat traded in Kansas city is the one most affected by poor US conditions we discuss below and is trading at a historic premium to CBOT wheat.  (As usual, agricultural commodity fundamentals prove themselves surprisingly complex). The soft red winter wheat crop condition is far better, though there are reports of slow plantings of spring wheat.
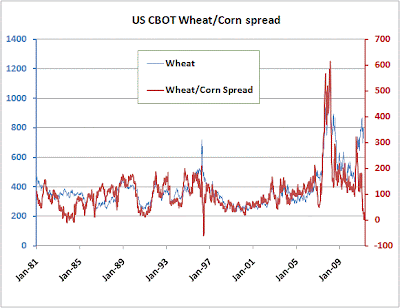
 - Global grain stocks - global grain stocks are very low in general - but corn stocks are almost desperate, at a mere few weeks of supply. So the near record price of corn relative to wheat (See chart below.) makes sense given current supply conditions up to this point, the question now being how those supply conditions change and whether relative price becomes a factor, which leads us to:
Supportive for the absolute and relative price of wheat:
 - Feed/food switching. For some uses, particularly animal feeds, the grains are relatively interchangeable and historic spreads between the grains are normally relatively stable within a certain range because of this, with the premium of soybeans over wheat and wheat over corn having largely to do with the relative protein content of the grains (soybeans have the most protein so they are the most expensive per pound historically). At current prices, there are tremendous incentives for those who can switch to wheat from corn in particular to do so. Relative soybean prices are near the tops of historic ranges as well.
 - Global crop condition and weather. The USA is the largest exporter of wheat. The latest US crop condition reports for winter wheat are downright awful, with 38% of the crop considered in poor or very poor condition, versus 6% this time last year. And spring plantings are proceeding very slowly. Other areas of the world are also challenged, including slow winter wheat plantings in Europe last year and current weather challenges in Australia and North Africa. Further weather disruptiongs could kick a new wheat rally into high gear.
It's important to note that the market is already pricing in that the premium for wheat versus corn will revert to its normal range well ahead of year end, but weather will be a critical factor in determining when this inevitable reversion takes place.
Charts
The following sequence of three charts shows why crop conditions are so terrible in key growing areas for winter wheat in the US:
Chart: US Drought Conditions
Drought conditions in the US show the extreme drought taking place in Texas and severe droughts taking place up into Kansas as well. The conditions are considered the worst since the early 1920's "dustbowl" drought: (source http://www.drought.unl.edu/dm/monitor.html)
 Chart: US Winter Wheat plantings
The chart above shows the areas of the US with the largest winter wheat plantings. (Source: http://www.nass.usda.gov/Charts_and_Maps/Crops_County/ww-pl.asp)
 Chart: Overlay of winter wheat/drought areas
The chart below overlays the largest winter wheat planting areas (drawn around winter wheat planting chart above) on top of the drought monitor, showing why so much of the winter wheat crop is stressed in the US. For now, the Chicago soft winter wheat contract has escaped much of the spillover from the stress to the hard red winter wheat growing conditions - but could demand spillover from scant hard wheat and corn supplies and a pinched wheat supply elsewhere in the world feed into higher demand for CBOT wheat?
 Chart: Wheat/Corn spread
The relative supply conditions have seen CBOT corn rally to record highs versus the CBOT wheat contract, with the front month reaching parity recently as shown above in the weekly chart. From here on out, weather will be a key factor in determining whether this spread can go even further in favor of corn or whether the high corn prices will erode relative demand for corn as buyers switch to wheat (and/or whether further fears of weather disruptions further aggravate the supply fundamentals for wheat as well). (Data source: Bloomberg)
 Chart: July and December Wheat/Corn spreads
The July Wheat/Corn spread has bounced a bit here. By December (as shown in the December spread, which is well above $2 per bushel), the market is already pricing in that the price relationship of the two grains will revert back to its historical range meaning a relatively small window for those who believe the relative price for the two commodities will revert in the near term. Note that the spread of spreads (December spread less July spread) has contracted a bit forcefully of late and is yet another way to look at how the market perceives the relative timing of when the imbalance in corn vs. wheat prices will balance out. (Data source: Bloomberg)
 We end this report with a tongue twister of a questions: Whither wheat prices as weather withers wheat supplies?

FX Update: CAD rallies anew on inflation data

A very strong inflation data point out of Canada pushed BoC inflation expectations higher and CAD stronger across the board. Should this be the focus or should the oil sell-off be of more concern for the currency? Also, will EURUSD complete a comeback or find resistance again soon?
RBA Minutes
The RBA minutes showed the central bank making relatively balanced comments on the Australian economy. It expected a pick-up in commercial property construction, noted a positive outlook for the Australia labor market and noted positive business investment. On the negative side, it suggested that there was still uncertainty in the wake of the Japanese earthquake, that housing and consumption are weak, and that Q1 growth would be “held down” more than originally expected after the violent weather earlier this year. It indicated that its view of current RBA rates was “appropriate”. All in all, this appeared slightly dovish and several bps were taken out of forward expectations for the RBA as the AUD weakened slightly.
Canada inflation
CAD had edged to the weak side over the last couple of days, first on an oil sell-off and then on yesterday’s risk swoon in the wake of the Finland election results and the S&P downgrade of the US debt outlook, but signs of a small comeback were already evident yesterday when USDCAD failed to close above the 0.9675 resistance area that it briefly broke through. Then early today we get a March CPI number out of Canada that showed both headline and core CPI vastly higher than expectations.
Already a popular currency because of its natural resource base, healthy economy, and lack of public fiscal challenges, the only chink in the CAD’s armor of late has been its low interest rate as the BoC is seen as reluctant to move too aggressively with the Fed still in QE mode. The BoC is justifiably worried about a hollowing out of Canada’s manufacturing economy from its strong currency. But the strong inflation report today saw BoC expectations snap sharply higher by about 10 bps (and the spread to US rates was already near the widest it had been recently in the first place) and saw CAD strengthening across the board. Those looking to stay away from the USDCAD cross might consider the relative merits of AUD and CAD: consider that the RBA seems unwilling to move much more on rates while the BoC seems to be just getting started. Indeed, AUDCAD was sharply lower in today’s trade and may have turned a corner here, as we discuss below.
Chart: AUDCAD
The Aussie has been more popular than CAD in recent weeks because of Australia’s direct exposure to Chinese commodity demand and due to the higher yield of the Australian currency, while the CAD has been capped due to the gravitational force of its neighbor to the south. But the rate spread between Australia and Canada at the short end of the curve has been drifting tighter for months now and got a further sharp tightening with the latest CPI number out of Canada. This report may have provided the starting point for a steeper sell-off for the pair.

Odds and ends
Germany’s preliminary PMI’s
for the month of April showed a further acceleration in the country’s manufacturing economy and adds to the incredible string of strong showings. On the negative side, the services PMI saw a bad miss and 2.4-point drop and lowest reading since last October, though still solidly in growth territory at 57.7.
Canada’s Core CPI month-on-month reading of +0.7% nearly matched the highest readings for the last 20 years of data. Past history has shown that every single one of those previous spikes has seen a mean reversion lower in the following months. In fact, in the majority of cases, the next month’s number was actually negative. Canadian numbers tend to be less smooth than those for many other countries – just a note of caution before we get too carried away with the implications of today’s inflation release.
The US housing starts and building permits data for Mar. were far stronger than expected, though still within the range of recent months. The US housing market remains a non-story as it will remain capped for many months, if not years, to come as the US transitions away from the GSE model of home loan financing and as the Fed slowly unwinds its support of the market. On top of that, there is a large inventory of homes that must be sold down.
Looking ahead
EURUSD consolidated well off its lows from yesterday, but the debt spread situation in Europe doesn’t suggest any letting up on the pressure on the Euro. The recovery in the pair may have as much to do with the strong bounce in risk appetite from its worst levels yesterday (there seems to be a Pavlovian response to every single sell-off representing an opportunity to Just Buy the Dip – shield your eyes on the next dip that fails to elicit this response), but one has to look at any Euro rally with skepticism as long as, for example, the Spain/Germany debt spread remains as wide as it has become over the last couple of days. There was a marginal tightening in that spread relative to the worst levels from yesterday, however, and this is reflected in not only the EURUSD bounce, but the strong bounce in EURCHF and EURJPY as well, which have been aided by the consolidation lower in bond markets. Stay tuned.
Tomorrow we have Sweden's Riksbank up with its rate decision. The bank is expected to move by another 25 bp increment to bring the rate to 1.75%. The overall outlook for risk and for the Euro are important for SEK. Tactical focus comes in the 8.90 area for EURSEK. MEanwhile, USDSEK looks like it is trying to form a base here in the 6.20/5 area. For a rally to materialize there, we would likely need a slight change of tone from the Riksbank and/or a risk sell-off as SEK tends to be a very pro-cyclical currency.
Economic Data Highlights
  • China Apr. HSBC Flash Manufacturing PMI out at 51.8 vs. 51.8 in Mar.
  • EuroZone Apr. Consumer Confidence out at -11.4 vs. -11 expected and -10.6 in Mar.
  • Germany Apr. preliminary PMI Manufacturing out at 61.7 vs. 60.0 expected and 60.9 in Mar.
  • Germany Apr. preliminary PMI Services out at 57.7 vs. 59.8 expected and 60.1 in Mar.
  • EuroZone Apr. preliminary PMI Manufacturing out at 57.7 vs. 57.0 expected and 57.5 in Mar.
  • EuroZone Apr. preliminary PMI Services out at 56.9 as expected and vs. 57.2 in Mar.
  • EuroZone Feb. Current Account out at -7.2B vs. -5.6B in Jan.
  • EuroZone Feb. Construction Output out at -0.7% MoM and +3.5% YoY vs. -4.6% YoY in Jan.
  • Canada Mar. Consumer Price Index out at +1.1% MoM and +3.3% YoY vs. +0.6%/+2.8% expected, respectively and vs. +2.2% YoY in Feb.
  • Canada Mar. CPI Core out at +0.7% MoM and +1.7% YoY vs. +0.2%/+1.2% expected, respectively and vs. +0.9% YoY in Feb.
  • Canada Mar. Leading Indicators out at +0.8% MoM vs. +0.5% expected and +1.1% in Feb.
  • Canada Feb. Wholesale Sales out at -0.6% MoM vs. -0.2% expected and +1.6% in Jan.
  • US Mar. Building Permits out at 594k vs. 540k expected and 534k in Feb.
  • US Mar. Housing Starts out at 549k vs. 520k expected and 512k in Feb.
Upcoming Economic Calendar Highlights (all times GMT)
  • US Weekly API Crude Oil and Product Inventories (2030)
  • Japan Mar. Merchandise Trade Balance (2350)
  • Australia Feb. Westpac Leading Index (0030)
  • China Feb. Conference Board Leading Index (0200)

Today's Call: GBPJPY – Bearish below 137.23

The buy recommendation for Q2 is underpinned by clear bullish signals that long term sentiment is improving and so far this is being confirmed. From the 7am open on Monday April 4 the cross rallied 400 pips in the first week, recording the strongest performance in one and a half  years. However on a daily basis the indications have been for stalling investor  enthusiasm at overstretched extremes and all through last week this was supported by increasingly bearish momentum signals warning that selling interest is strengthening. Going into this week, prices have now pulled back 50% of the rally since the end of March ( 130.12 – 140.03 ) and the forecast is bearish below 137.23 to 133.89, a broader 62% correction, then April’s 133.23 bottom or potentially 132.00.
Risk to this forecast would be buying through Wednesday’s 137.23 top. This should be a bullish signal that sentiment is improving again and further gains are likely to retest last Tuesday's top at 138.60 then the April high at 140.03.


FX Update: S&P puts US debt on negative outlook. So what?

The big news shaking the market this morning, even as it is already trying to deal with the important Finnish election results from this weekend, is the S&P outlook downgrade on US debt to negative from stable. Is this significant or merely a confirmation of what has been obvious for months?
The tremors induced by the Finnish election results were all of the focus this morning until the S&P ratings agency put the US sovereign debt rating outlook on negative from stable. This kicked volatility into high gear and is providing a very interesting test for this market at the moment. The world is already very short the USD on the obviously shaky fiscal prognosis for the US and its feeble attempts to wrestle with its debt demons. The ratings agencies are often rather behind the curve on moving to adjust ratings on sovereign debt for fairly obvious reasons (not wanting to step on political toes, etc.), so while the announcement had a kneejerk weakening effect on the USD, the ironic thing could be that this serves to help strengthen the USD if the market decides to take some of its current chips off the table (which might have more to do with the European situation than this S&P announcement in the first place). We’re already seeing that reaction to some degree as we write this just before publishing, as most of the initial move in the USD to the weak side has been erased. Stay tuned, we’ll follow up on this later.
EURGBP: End of uptrend?
Meanwhile, elsewhere, those trying to simply get their bearings on how the Euro is trading without the USD influence can have a look over at EURGBP,  which has come well off its highs of last week on this latest tremors induced by the Finnish election result. Today’s action is  a significant follow up on the rejection of last week’s new highs and looks like a game changer for the pair, suggesting that the pound will gain the upper hand for now. The next focus is the 0.8675 area.
China tightens again.
China raised its bank’s reserve requirement ratios yet again on further signs of a crackdown on lending. Meanwhile, we should also keep our eye on copper prices due to the parallel/unofficial credit system centered around the practice of using warehoused copper as collateral as we note copper prices are close to their lowest levels for the month. At some point to the downside, a trigger point awaits that could generated a rather disorderly market if significant physical supplies are suddenly in need of liquidation. As for the fallout in the Chinese banking system – it’s hard to gauge, but it wouldn’t be particularly helpful. It’s very interesting to note the
Looking ahead
It’s a short week in Europe this week with Easter holiday up on Friday (and earlier in some cases with some countries also taking Monday off). The uncertainty surrounding the shape the Finnish government will take and the pressure on European debt spreads will be the critical focus this week for the Euro.
Elsewhere, it is fascinating to watch the reaction across markets after the S&P US outlook downgrade as Bunds are absolutely screaming higher - as they seem to represent the only safety trade (besides the Swiss franc), which is squeezing higher again) when the US sovereign debt situation is in play.
The S&P announcement also has EURJPY under pressure. For all of the JPY crosses, one must be kept on the 82.50 area in USDJPY that we talked about late last week, as it is the confluence of the daily Ichimoku cloud and the 55-day moving average. The market hasn’t really been prepared for a rally in government bonds, and the JPY crosses, after the initial large adjustment to the ongoing post-earthquake/tsunami/nuclear crisis, are now firmly back to correlating tightly with bond markets. The question is, do US and European bond markets diverge here or will the market quickly get over this outlook downgrade?
On the event risk calendar for the next couple of days, watch for the European preliminary PMI surveys out tomorrow for possible signs of a slowdown beginning to finally rear its head and also watch out for the US housing starts and building permits tomorrow and Goldman Sachs earnings out tomorrow morning as well.
Economic Data Highlights
  • New Zealand Mar. Performance of Services Index out at 50.8 vs. 50.8 in Feb.
  • New Zealand Q1 Consumer Prices rose +0.8% QoQ and +4.5% YoY vs. +1.0%/+4.6% expected, respectively and vs. +4.0% YoY in Q4
  • UK Apr. Rightmove House Prices rose +1.7% MoM and +0.1% YoY vs. +0.9% YoY in Mar.
  • Canada Feb. International Securities Transactions were +2.5B vs. +10B expected and +13.4B in Jan.
  • US Apr. NAHB Housing Market Index out at 16 vs. 17 expected and 17 in Mar.
Upcoming Economic Calendar Highlights (all times GMT)
  • US Fed’s Bullard to Speak on Banking Rules (1600)
  • US Fed’s Fisher to Speak on Economic Outlook (1630)
  • UK BoE’s Weale to speak (1630)
  • Australia RBA April Meeting Minutes (0130)
  • China Apr. HSBC Flash China Manufacturing PMI (0230)
  • Japan Mar. Consumer Confidence (0500)

Ratings and Recommendations