Financial Advisor
Showing posts with label Chart Of the Week. Show all posts

USDCHF - Bullish above 0.7486

Our bearish call for USDCHF sentiment for last week was confirmed with aggressive selling that took it more than 5 big figures lower – to new all-time lows. But these lows were not maintained. In fact, all initial losses were powerfully reversed and although this rally was inspired by non-technical factors, the formation of a Bullish Hammer on weekly candle charts indicates scope for gains to continue.

In view of this our call is Bullish above 0.7486, although exact risk levels in such volatile conditions are hard to gauge. The immediate objective is 0.7836, the open from August 2nd, with a move beyond that point targeting 0.7954, the 2-week peak, then 0.8119, the open from 3 weeks ago.

The risk to this call is that the improvement was more temporary and limited than currently assessed and this would be signalled by a move below 0.7486, 38% pullback of Thursday’s net rise. Prices and sentiment should then fall to 0.7265, that day’s open, or even 0.7181, Wednesday’s base.


FX Weekly Chart Wrap

Today's close in the major currencies offers an interesting setup for next week, with the Euro rocketing higher on tough talk from Trichet and the JPY wilting on widening interest rate spreads. What should we look for next week?
Last week, by all appearances, we saw a major move in the USD that appeared to set up the potential for follow through this week. But that follow-through was halting at best and instead we got a huge reaction to Trichet's surprisingly hawkish words on inflation and other encouragement in Euro crosses because of short term relief on the PIGS sovereign debt issue. So the focus shifted dramatically from USD strength to Euro strength. Below we highlight some of the more interesting charts on the close of this week.
Chart: EURUSD
Last week's weak close near the lows is followed up by this week's strong close. The key resistance at the 11-week (55-day) moving average is still in place, though one can also say that the attempt to break below the 200-day (40-week) moving average failed this week. Needless to say, this chart appears very much in limbo. Bulls can argue that we are in for a test of the 0.618 Fibo up above 1.3700 after the show of support this week. The flatline area around 1.3435 has been critical on a number of occasion recently and now happens to coincide with that 55-day moving average.
 Chart: EURJPY
EURJPY saw enormous gains this week as Trichet broke out the hawkish rhetoric and on "successful debt auctions" from Spain and Portugal. Note that the pair has now paused right at the bottom of the daily Ichimoku cloud, which also happens to be close to the 55-day moving average. The action has been awfully steep, but so then too has the acceleration in interest rate spreads.
 Chart: USDJPY
On the USDJPY side as well, the pair saw a new low for the week today rejected. Also interesting is that we are trading near the Ichimoku cloud levels and the 55-day moving average and that today's candle suggests a bullish reversal, though on relatively low volatility. This is a reverse image of bonds, which rallied, but then failed to hold the gains - bullish for USDJPY if we see follow through in the bond selling next week.
 Chart: AUDUSD
A curious market, as we have copper closing the week strongly while silver and gold are closing near their lowest levels in come time and below key moving averages. Meanwhile, risk appetite has gone virtually ballistic in the US stock exchanges. Technically, the pair looks relatively bearish, though we need to see a close to a new low for some confirmation of whether the pair really wants to take out that 55-day moving average.

Looking ahead
Next week the focus will be on whether the gains in European interest rates can hold and whether EURUSD and EURGBP can take out the next key resistance levels. While it seems crazy to think that Trichet could pull the lever on rates in this environment, he did raise rates as the world was sliding into oblivion in July 2008, so maybe we shouldn't underestimate his willingness to throw himself under a bus again. 12-month forward expectations, by some miraculous logic we have no access to, are looking for 67 basis points of tightening from the ECB.

Weekly Market Wrap Up With Steve McDonald

Welcome to this week's market wrap-up with Steve McDonald. A few weeks ago Steve talked about a large corporation that was shifting focus and moving into the data management field. The company is now rumored to be a takeover candidate by some the biggest names in the tech industry. A major agriculture player just announced tremendous earnings-per-share numbers, and Steve says it's just the start of a huge demand increase. Some bad news coming out of Canada and our northern border states could mean big profits if you take Steve's advice and act now, and one of our experts may need to revise his gold price projections. And finally, the Slap-In-The-Face award, where socialized medicine is causing outrage in one European country.
Christian Hill
Managing Editor
Investor's Daily Edge 

FX Update: EURUSD to spike higher still?

John J. Hardy, FX Consultant.

FX Update: EURUSD to spike higher still ?

The Euro squeeze is still definitely on as we start a new week in financial markets. Supporting the nearly across-the-board upside in Euro once again today after an already sharp move higher last Thursday and Friday is the collapse in intra-European sovereign debt spreads and apparently the spike in European yields at the short end of the curve, as reflected in the yields of instruments like German t-bills and Euribor. As well, the higher Euro represents the pain trade for so many macro portfolios out there that have been shorting the currency aggressively all year until the last several weeks, which is probably providing a form of latent supply of Euro buying all the way up.
On Friday, we mentioned the rise at the front end of the European curve possibly being about a removal of the safety premium for holding non-PIGS debt (most importantly, German debt) while noting the relative easing in the type of "counterparty risk" trades that suggest a banking system in crisis. (If we remember back to the US financia crisis, the counterparty risk trade was a key story that developed for months and was only snuffed out starting several weeks after the actual Lehman bankruptcy event after an unprecedented spike.) At the same time we have the easing in Euro sovereign debt spreads, particularly for Spain, where the 2-year spread vs. Germany has collapsed to 128 bps from about 175 bps last Thursday and over 200 bps as recently. This is an enormous move.
All of these factors suggest an easing situation in Europe on the surface: but the most important question here is possibly whether higher yields at the front end of the curve mean an easing fear level or a rising fear as the rate spike represents a scramble for Euro liquidity. The latter explanation actually makes more sense and is one we haven't considered sufficiently as we were distracted by the lack of evident fear in counterparty risk (which was a hallmark of the US credit crisis). That's because the ECB has responded sufficiently strongly to keep counterparty risk off the table (no banks of any size allowed to fail) and has the firepower to backstop the sovereign debt situation for a time as well (especially now that China seems to want to jump in and buy sovereign debt, too - perhaps with the hopes of a stronger Euro as the real agenda. Yet, overall, liquidity remains very tight, especially for speculators with large positions funded in Euro that are beginning to feel the pain, and as everyone scrambles for cash, there aren't enough Euros available. So the question now is how much further we have to go in the squeeze process. In the EUR/pro-risk trades, there may be a very long way to go, especially if we see any follow through on Friday's very ugly move in the risk trades. In EURUSD, it is tougher to estimate - have a look at the chart below.
Chart: EURUSD vs. 2-year swap spreads
If the continued widening in interest rate spreads are supposed to reflect a scramble for Euro liquidity, then we might expect for the EURUSD rally to only end once Of course, at any time, a strong official response by the ECB or very large EUR selling from central banks that are relieved to see EUR back at these levels could slow the rally. Our assessment of the dynamic is this: it can go anywhere in the short term, but the higher it goes, the better the sell opportunity for the long term since this seems to be mostly about a short-term liquidity event rather than the long-run fundamentals, which have been adjusted permanently lower for the EuroZone by this year's crisis. It's one thing for rates to rise because of hawkish expectations for a central bank, another thing entirely when they rise for the liquidity reasons. In any case, an reversal in the widening spreads at the front end of the curve will likely coincide with an end to the EURUSD rally.


HUF and puff, and blow the Franc down
The IMF announced over the weekend that it refused to advance a planned $25 billion dollar payment to Hungary after it noted sufficient progress in Hungary's efforts to right its public finances. This was of course met with a gap lower in the HUF to open the week, but the action in EURCHF also reminds us of the aspect of the Swiss franc that has bothered us all along - the risk of default on Swiss franc loans extended during the bubble years (whereas the market has . Remember that most Hungarian mortgages were financed in CHF in those years... Of course, the EURCHF rally here has been aggravated by the EUR liquidity squeeze as well.
Looking ahead:
After the Friday meltdown, the direction in risk appetite is as important as ever and we're still surprised at the lack of response in volatility fears in the likes of the VIX and FX vols - that's either divergence that should encourage the bulls or a sign of excess complacency....
The other main highlights this week is the presentation of the stress tests for European banks, an event risk that could also provide an inflection point for the Euro rally. Ahead of that, however, we have Bernanke's semi-annual testimony before Congress on Wednesday and Thursday - a critical event for Fed watchers, as it represents the ideal forum for the Fed announcing a move in a new direction.
Other highlights this week include:

Today:
  • US July NAHB Housing Market Index - normally a very good leading indicator on the US housing market, though it gave off a very strange spike in May that was erased in June. Would expect a very low reading on this survey today that suggests very slow interest in new home buying in the US.
  • Australia RBA Meeting Minutes - key for Aussie rate expectations, which recently crossed below zero for the year ahead before rising a bit again.
Tuesday
  • US Jun. Housing Starts and Building Permits - market looking for further double dip confirmation here for housing.
  • Bank of Canada Rate Announcement - most expecting another hike, but should we be looking for a further deceleration in the hawkish rhetoric as the BoC nervously eyes the slowdown south of the border and budding signs of weakness in Canada as well? Still over 100 bps priced into the year forward for the BoC.
Wednesday
  • UK BoE Minutes - looking for whether the bank is waffling on its dovish inflation view after the latest troubling signs of sticky inflation levels
  • US Fed's Bernanke Humphrey Hawkins testimony - there is a gathering storm in the US economic data, and the recent FOMC minutes suggest an increasing feeling by many in the Fed that the recovery is failing. This could be an interesting performance by Bernanke as the market puts out feelers for when and to what degree the Fed is looking to head for QE, Part Two.
Thursday
  • EuroZone Jul. Preliminary Manufacturing and Services PMI - amazing how resilient these have been in the face of the crisis - will we finally see more definite signs of slowing?
  • Canada May Retail Sales - not a particularly timely report and the data series is very choppy. Still interesting to see this report after a very weak April reading
  • US Weekly Initial Jobless Claims - last week looked encouraging, but this is the trickiest time of the year for seasonal adjustments  - this week and next week should be important for establishing whether the claims levels are really improving.
  • US Jul. Existing Home Sales - weak number expected
Friday
  • Germany Jul. IFO - spectacular that this index has remained so elevated through the crisis - but the DAX is not that far from highs for the cycle either (the two often move hand in hand). The stronger Euro could help this survey register a sizable drop this time around.
  • UK Q2 GDP - expected at a relatively strong 0.6% QoQ by consensus, the best since 2007. The last hurrah?
  • Canada Jun. CPI - inflation is certainly not the driver for BoC policy.
Economic Data Highlights
  • New Zealand Jun. Performance of Services Index out at 55.7 vs. 53.5 expected
  • UK Jul. Rightmove House Prices declined -0.6% MoM vs. +0.3% in Jun.
  • EuroZone May Current Account out at -5.8B vs. -5.6B in Apr.
  • EuroZone May Construction Output fell -1.0% MoM and -6.3% YoY
Upcoming Economic Calendar Highlights
  • US Jul. NAHB Housing Market Index (1400)
  • Australia Jul. RBA Meeting Minutes (0130)

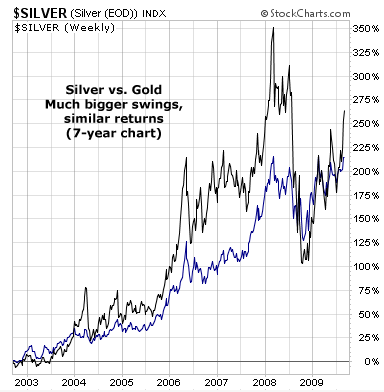
SILVER VS GOLD THE PAST SEVEN YEARS


A big question for the precious-metals investor is "Gold or silver... which do I choose?"


Our chart of the week might help you pick. It says: Long term, the returns are similar... but holding silver requires a bottle of Tums at your side.


This chart compares silver's performance (black line) versus the performance of gold (blue line) over the past seven years.


Up until a few months ago, silver and gold were both up 200% since 2003. Silver has enjoyed a surge since August to nudge higher in the race. But the major thing to take away is this: Silver goes through much bigger swings than gold. It suffered a 56% downswing in 2008, for instance.


So... the market's answer to the above question is, "Unless you have a strong stomach, keep most of your precious metals portfolio in gold."


– Brian Hunt


Silver, Gas, Oil & Gold Report

Another crazy week in commodities with precious metals and precious metal stocks surging higher on heavy volume, while natural gas and crude oil move lower. Money seems to be rotating out of energy and into precious metals.


Spot Gold Bullion – Weekly Trading Chart
Gold jumped higher today breaking out of its 6 month pennant pattern. If prices can hold into the weekend then I expect the $1000 per ounce to be reached quickly. Also Gold stocks took off like rockets, which are a strong sign that gold will follow through on this breakout. It will be interesting to see what happens from here.


Spot Silver Bullion – Weekly Trading Chart
Silver and silver stocks are shooting higher as well.


Natural Gas – Monthly Trading Chart
Natural gas continues to trade lower. The good news is that the price of natural gas is now at a major support level, which was formed as far back as 1996. The weekly natural gas chart shows much of the same price action that oil had before reversing to the up side in February of this year. I would not be surprised, if we see buyers stepping into natural gas at this level.


Crude Oil – Weekly Trading Chart
Crude oil continues to trade within its bullish wedge pattern. We will be looking for a low risk entry point for oil this month using the daily chart.


Commodity Trading Conclusion:
Precious metals are showing strength while the energy sector continues to have selling pressure. Gold, silver, natural gas and oil look ready to make big moves in the coming weeks and, being positioned on the right side, will generate some massive profits.


Staying focused for low risk entry points is important when volatility and emotions are running high. The excitement/stress for traders this week is very high. With precious metals and precious metal stocks breaking out today on massive volume, it has traders excited or in a panic, if they are not positioned yet. To add more fire to the week, natural gas continues to fall, triggering a panic sell reaction by many investors/traders.


I do like precious metals as a bull play here, but risk is a little higher than I would like. The past couple months precious metals have been jumping around like a yoyo, making it very difficult to find a low risk entry points.


I know many traders are in serious pain, because they bought natural gas a couple months ago, expecting a rally which did not happen. I would like to mention that I am seriously starting to think about scaling into Natural Gas over the next 1-2 months. Natural gas reminds me of a Canadian fund XTR, which I scaled into last February and am now sitting with a very healthy gain, not to mention a 16% dividend. I feel Nat Gas will pay off huge over the long run, but it will take some time to bottom.


Good Investing.
Chris Vermeulen

A BAD SIGN FOR CHINESE STOCKS - Brian Hunts Market Notes

Let's call today "fun with trend lines" day.

A trend line is a stock chartist's way of tracking the health of trends in stocks, currencies, and commodities (you can read the excellent Trader Vic book for the full story on them). The theory goes, once an overpriced, popular asset "rolls over" and breaks through its trend line, it's a good time to short the asset. It's a sign the trend's upward momentum is broken.

Today's chart displays the year's trading action in the Shanghai Composite Index. This is the most widely used gauge of Chinese stocks... and it's close to exhibiting a classic trend line break.

We can't know if this new decline and trend line break will turn into a big wipeout... but we can say that every large decline begins as a small one. If you've been itching to bet against Chinese stocks, the market is getting on your side.

Chart Of the Week - This is the Must - Watch Chart Right Now


This week's chart comes courtesy of investors who are skeptical of the U.S. government's "bailouts for everyone" scheme. It's the chart of gold's latest assault on the $1,000 mark.

We encourage all our readers to keep a portion of their wealth in gold – not as a trading vehicle, but as real, tangible money... as insurance against crazed government spending.

Either way, the market likes gold. As you can see from this week's chart, gold has gained $50 per ounce in the last month to mount another assault on $1,000.

We wouldn't be surprised to see gold pull back a bit in this new foray toward quadruple digits. Gold trades in an inverse relationship to the dollar, which is oversold and due for a bounce higher.

The Big Mac Index Shows the Euro Is Way Overvalued


But if it takes the $1,000 level after that, we'll have cleared a 19-month consolidation. And we'll have a market saying, bailouts for everyone is a bad idea.

– Brian Hunt

Silver Chart Of the Week


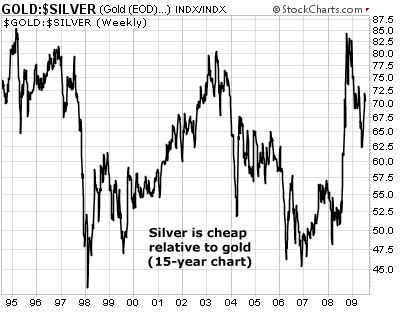
SILVER IS CHEAP

Another reason to consider silver as a chaos hedge: It's cheap relative to gold, its precious-metal cousin.

As you can see from our chart of the week, silver and gold trade in a "band" relative to each other. This band is called the gold/silver ratio.

Generally speaking, silver is expensive relative to gold when the ratio sinks below 50. This is a reading that typically occurs after silver has enjoyed a huge run higher. Silver is cheap relative to gold when the ratio is above 70.

Right now, the gold/silver ratio is around 70... which leaves silver in the "cheap" category.

– Brian Hunt

GREAT NEWS FOR TRAVELERS


Just over a month ago, our chart of the week featured a "bearish call" on the pan-European currency, the euro.

You can read Steve's case for a weaker euro here. And you can see it playing out in stunning fashion with this week's chart. The euro is suffering one of the greatest short-term declines a major currency has ever seen.

What does the euro's fall mean? Expect financial headlines in Spain, Italy, France, and Germany to get much weaker. Expect European interest rates to fall.

And given the increase in purchasing power of the U.S. dollar versus the euro, consider planning your next European vacation...

– Brian Hunt

Ratings and Recommendations