Financial Advisor

Japanese Yen Rises on Signs of Economic Recovery

The Japanese yen rose on Thursday on signs of economic recovery in Japan, following better than expected housing starts data. At the moment, the U.S. dollar lost 0.43% of its value to trade at ¥80.42, while the euro edged lower to ¥116.54, down 0.07%.
The yen found strength in better than expected housing starts data. In May, Japan’s housing starts were 6.4% above the level in May 2010. This represents a significant improvement on April’s 0.3% and 3.5% predicted by most analysts. The latest data suggest Japan’s reconstruction program is starting to kick in.
Japan has been rocked hard by the earthquake/tsunami disaster. Its economy shrank in the first quarter of the year, as a result, and traders are hoping that the government’s reconstruction plan can provide enough boost for the Japanese economy to make a strong rebound in the June quarter.
Japan’s manufacturing activity data, also released today, is less encouraging, however. In June, Japan’s Manufacturing PMI fell slightly from 51.3 in May to 50.7 in June. Good news is that is spite of the fall, the June value still indicates expansion. The output part of the index rose from 51.5 in May to 52.7 in in June. At the same time, the exports component fell from 49.2 to 49. The data suggests that output is recovering following energy shortages and supply disruptions. Some traders might be worried that exports are not rebounding and are still below 50, which indicates exports are contracting.
From the Asian-Pacific currencies, the New Zealand dollar also put up a good performance in today’s trading. The Kiwi added value against the greenback and is following the euro rebound. At around 6:50 GMT, the greenback stood at 1.2067 (down 0.38%), while the euro traded around 1.7487, or the same as yesterday’s close.

Porter Stansberry - Why a Full-Scale Economic Collapse Is Inevitable


New American Socialism began with the policies of President Franklin Delano Roosevelt.

In 1933, FDR seized all the privately held gold in the U.S. and began creating the massive government programs necessary to implement socialism. To give you some idea of how much the federal government grew during FDR's reign, remember federal spending made up 3% of GDP in 1930 – a level that had been fairly consistent for most of America's history. Almost immediately after his election, he tripled federal spending to more than 10% of GDP. And by the time he died in office, federal spending reached 44% of GDP – an all-time high.

As everyone should know by now, the promises of socialism aren't affordable. Robbing Peter to pay Paul is inefficient and kills Peter's incentives. The result is usually economic stagnation, depression, and eventually a crisis that frees people from the government's confiscatory repression.

Because America was the only large economy standing after World War II, it took much longer than usual for the problems of socialism to appear in our economy. Also, the government scaled back many of FDR's policies during the post-war boom. In winning the war, we also won a generation of economic spoils.

All this changed in the 1960s.

Lyndon Johnson had delusions of government-led grandeur. His ideas of a "Great Society" and "Model Cities," along with an expensive foreign war (Vietnam), were a recipe for massive new debts and an increasing role for government in all aspects of American life.

These policies led to an acute funding problem in 1971, because the debts of socialism couldn't be financed with gold-backed money. It was far too expensive. And so we began a new kind of socialism… the New American Socialism.

What happened in 1971? The size of America's government deficits forced us to abandon gold. After World War II, the U.S. dollar became the world's reserve currency. In exchange for placing the dollar at the center of the world's economy, we made a solemn promise to always exchange the U.S. dollar for gold at $35 an ounce.

Nixon broke that promise, calling our creditors "global speculators" and telling them to go pound sand.

This move away from gold severed the fundamental tie between our economy and our money. Without the link to gold, bank reserves could be created by fiat. And they were. This led to a huge expansion of our money supply and our debts.

The power to use this debt and to control the creation of new money is the most powerful factor in our economy. The government can now create unlimited amounts of credit to control the U.S. economy. This bestows favored status on certain companies – notably banks. This lies at the core of our economy's structure. It is how fiat money privatizes the benefits of New American Socialism.

Most Americans simply don't understand our historic tie to gold made it impossible for the banking system to grow beyond clear boundaries. Gold limited the amount of currency in circulation, which, in turn, restricted how much money banks could lend. Under the gold standard, the maximum total debt-to-GDP ratio was limited to around 150%. But as soon as we broke the tie to gold, our total debt-to-GDP ratio began to grow. It's now close to 400%.

Without the tie to gold, the amount of economic mischief our government could engineer became practically limitless. No social goal was too absurd… no war too expensive… and no government insurance scheme too patently self-serving not to finance.


Today, New American Socialism has spread like a cancer throughout our country, afflicting industry after industry.

Like a cancer, once it infects an industry, it metastasizes from company to company in that sector. Suddenly, businesses cannot function without massive government aid. These corporate wards of the State weigh down the rest of our economy… making us weaker and less competitive and dragging us further into debt.

Keep in mind, this New American Socialism I'm talking about isn't called socialism at all. It goes by many names. It's been called "compassionate conservatism." It's been called "joint public-private enterprise." It's been called "government insurance."

I've been studying it for many years – finding it in one company after another. I've actually preferred having it in many of the stocks I've recommended over the years because it tends to be good for investors.

That's the most insidious thing about New American Socialism: It's a form of socialism that leaves the profit motive in place.

That's why the New American Socialism has grown decade after decade. That's why it continues to be heavily promoted by almost every mainstream media outlet and both political parties.

It leads to a kind of corruption I believe will be impossible to stop without a full-scale economic collapse.

Regards,

Porter Stansberry
 

Stages of the Collapse (a must read article.click here)


Mid-Day Report: Commodity Currencies Soar on Risk Appetite

Commodity currencies are all strong today as boosted by recovery in global risk appetite on optimism that Greece would avoid an immediate default. Data from Canada maintains a firm tone in the loonie. Canadian GDP avoided a contraction in May and was flat m/m. Crude oil is staying firm around 95 level for the moment and helps support the loonie, which will likely extend the CPI triggered rally against dollar in near term. This week's data fuel speculation that while BoC would likely be on hold in Q3, it may restart tightening in Q4.
New Zealand dollar rises to new record high against dollar today, getting additional boost from RBNZ Governor Bollard and confidence data. Bollard said that "rising commodity prices are improving export incomes but putting pressure on the exchange rate." Bollard noted that the New Zealand economy will continue to be driven by growth in our East Asia and Australian trading partner" and "volatility will pose challenges for monetary policy." NBNZ business confidence jumped sharply from 38.3 to 46.5 in June.
Greece's development will remain the focus of markets in near term. The article-by-article approval of the austerity plan is expected to be just a formality. Investors are expecting EU and IMF to approve release of the EUR 12b tranche of the EUR 110 bailout package to Greece in July when finance minister meet on July 3. Meanwhile, focus is gradually shifting to the formulation of the second bailout package for Greece, and in particular, on how private investors would be involved. Some details would be released after German banks meet with the Finance ministry.
Sterling is one of the weakest currency today, as driven by strong rally in EUR/GBP. Economists continue to delay the expectation of rate hike and some are now forecasting BoE to be on hold till next Q2 2012. Economic data from UK provided no help to the poind neither, with Gfk consume sentiment dropped more than expected to -25 in May. Nationwide house price index was flat in June, below expectation of 0.1% mom rise as demand in the housing market remained subdued.
Other data released today saw US initial jobless claims roe to 428k in the week ended June 25. Eurozone CPI was unchanged at 2.7% yoy in June, M3 money supply grew 2.4% yoy in May. German unemployment dropped less than expected by -8k in June while unemployment rate was unchanged at 7%. Japan housing starts rose 6.4% yoy in May, PMI manufacturing dropped to 50.7 in June.

USD/CAD Mid-Day Outlook

Daily Pivots: (S1) 0.9650; (P) 0.9737; (R1) 0.9785;

USD/CAD's decline is still in progress and reaches as low as 0.9653 so far in early US session. Intraday bias remains on the downside with 0.9714 minor resistance intact. As noted before, , rebound from 0.9444 low should have completed at 0.9912 already. Further decline is now expected to retest 0.9444 low next. On the upside, above 0.9714 minor resistance will turn bias neutral and bring consolidations. But recovery should bel limited below 0.9912 resistance and bring fall resumption.
In the bigger picture, at this point, there is no indication that medium term down trend from 2009 high of 1.3063 has completed yet. Outlook will remain bearish as long as 0.9973 resistance (38.2% retracement of 1.0851 to 0.9444 at 0.9981) holds and further fall could be seen towards 0.9056 key support (2007 low). Though, we'd again start to look for reversal signal as USD/CAD approaches this key support level. Meanwhile, sustained break of 0.9973 will suggest that USD/CAD has indeed bottomed out already and should bring stronger rally towards 1.0851 key medium term resistance. 

Emergency crude oil stock release – more show than show-stopper!

On 23 June the IEA announced its member countries were releasing 60 million barrels of oil from emergency stocks in response to the ongoing loss of Libyan oil production and to combat the negative effects stubbornly high oil prices were having on global economic growth. This will lower oil prices in the short-term, however, longer-term a structural bull market in oil remains intact.
Putting the move in perspective
Whilst the move by the IEA in itself may appear drastic given it has only occurred three times in history, see chart 1 below, the amount released remains a ‘drop of oil in the ocean’ when looking at global consumption. The Energy Information Administration (EIA) estimates global crude and liquid fuel consumption at 86.7 million barrels per day (m bb/d ). Therefore the emergency release does not even represent a single day of consumption. 

The move has had, and in the short term will continue to have, a negative affect on oil prices. But it does little to address growing supply concerns. Further, with the EIA forecasting consumption increases of 1.7 m bb/d, OPEC supply decreasing by 370k bb/d and Non-OPEC supply increasing by merely 590k bb/d the quandary becomes evident.
Also, OPEC’s supposed spare capacity largely relies upon Saudi Arabia, as highlighted in our previous theme OPEC’s Quota indecision might not be that bad after all, with approximately 3.5 m bb/d of production capacity. Historically, however, it has produced a maximum of 9.7 m bb/d leaving many to question whether the remaining capacity is achievable.
Chart 2 highlights that despite previous interventions, similar to that of last week, the oil price has continued its northerly summit. Furthermore, we have previously highlighted potential oil company investment candidates in our theme the link between the cheapest oil companies and their reserves. 

Net Net – Net Long!
The 'shock' move by the IEA highlights the concern surrounding stifling economic growth and the necessity to fight inflation. But it also highlights that the group has come little way to solve the broader supply/demand concerns that will drive future oil prices higher.

EURUSD moves back toward unchanged as situation in Greece remains fluid

With the Greek austerity plan voted on, the next focus will be the rubber stamping of the implimentation (tomorrow) and the EU/IMF funding on Sunday. There is little reason to expect any other outcome. The bond restructuring plan is another can of worms, however, with French Plans coming under more criticism of late. Let’s face it, the situation in Greece is complex with tentacles that extend out. As a result of the uncertainty, one would expect that the EURUSD would come under pressure. However, in order for that to come to fruition, the focus must remain on the hurdles in the EU that lie ahead. The fundamental influence that can reverse the bias would be if a credible solution is found (and/or the market believes it) and if things like the US debt extension has problems. Time is ticking for that so it can override the EU issues if it is allowed to happen.
The other thing known is that the risk is increased in these fluid times. As a result, moves like we saw in the EURUSD this morning on the back of 1 vote by a Greek parliamentary member when the EURUSD lost 100 pips in less than a minute, could be more frequent. Be aware. Be prepared. Watch the chart levels.
From a technical perspective, the pair tested a trendline on the hourly chart at the 1.4350 level (low since the vote was sealed) and will be the short term level I will be watching today for support. A break of that level should solicit additional selling with the 1.4327 low (was a key ceiling yesterday) being the next key level to eye. If the EURUSD is going to go lower, it must get through these two key levels. Otherwise, in the absence of a break the bias today will remain more supportive in the pair. 

US Pending Home Sales Soar, Best Rate Since November


Pending Home Sales (MoM):    Survey:  3.0%    Actual: 8.2%    Prior:  -11.6%    Revised: -11.3

Seasonally Adjusted(MoM%)
U.S: 8.2% vs  -11.3%
Northeast:  7.3% vs 1.7%
Midwest:  10.5% vs -9.4%
South:  4.1% vs -17.2%
West: 12.9% vs  -8.9%
Level Change
U.S:  6.7 vs  -10.5
Northeast: 4.7 vs  1.1
Midwest: 7.9 vs -7.8
South:  3.7  vs -19.0
West:  11.5 vs -8.7
Unadjusted (YoY%) Change
U.S:  15.5% vs -26.6%
Northeast: 8.4% vs -30.8
Midwest: 20.7% vs -28.9%
South: 16.0% vs -26.7%
West: 14.9% vs -19.9%
Level Change
U.S:  88.8 vs  82.1
Northeast: 69.2 vs 64.5
Midwest: 82.8  vs 74.9
South: 95.0 vs 91.3
West:  100.6 vs  89.1
Pending Home Sales (YoY):      Actual: 15.5%      Prior:  -26.8   Revised: -26.6

Greek vote eyed; Buy-the-rumour-sell-the-fact for the EUR?

The Greek vote looms Wednesday (expected about 0900GMT) and ahead of that Asia kept currencies confined to tight ranges. On the data front, Japanese preliminary industrial production rose by a faster pace in May, continuing the healthy rebound from March’s 15.5% y/y slump. Predictions on manufacturers' output, the core component of production came in a tad softer; with June's forecast revised down to 5.3% versus a preliminary 7.7% increase and July's output is expected to rise by a mere 0.5%.

Looking ahead, apart from the Greek vote, Europe focuses on UK index of services, consumer credit, money supply and mortgage approvals, EU confidence surveys and Swiss KOF indicator. North America sees the release of Canada’s CPI and house price index along with US pending home sales.

Tuesday, the EUR managed to overcome some early negatives to finish on the up, with a fresh attempt on the key 1.44 level. News of protestors clashing with Greek police and soft data in the form of weak retail sales from Sweden and a mild downward revision to UK Q1 GDP kept the mood subdued before the positives hit. China’s Wen reiterated that they would buy an “appropriate amount” of EU debt, more hawkish comments from ECB’s Trichet (strong vigilance again) and German banks’ apparent willingness to adopt the French proposal for Greek debt rollover all combined to introduce a better tone for risk appetite while news that France’s Lagarde will be the new IMF head from July 5 also helped.

US data was mixed with US house prices, as measured by the S&P/Case-Shiller 20-city index, coming in slightly better than expected at -0.09% m/m but consumer confidence was a disappointment with a dip to 58.5 from 61.7 last. The Richmond Fed manufacturing index defied recent releases with a surprise uptick to +3 from -6 and an expected -3. Wall St had another good day with the DJIA rallying 1.21%, S&P 1.29% and the Nasdaq +1.53%. US yields ticked higher as safe-haven demand waned and supply loomed. The $35 bln 5-year auction went better than yesterday’s 2-year with a bid/cover ratio of 2.59 and a yield of 1.615%. USDJPY found more support as a result and breached the 81.0 mark.

Economic Data Highlights
  • US Apr. S&P/CaseShiller 20-City Index out at -0.09% m/m vs. -0.2% expected and revised -0.26% prior
  • US Jun. Consumer Confidence out at 58.5 vs. 61.0 expected and revised 61.7 prior
  • US Jun. Richmond Fed Manufacturing Index out at +3 vs. -3 expected and -6 prior
  • JP May Industrial Production out at +5.7% m/m, -5.9% y/y vs. 5.5%/-6.3% expected and 1.6%/-13.6% prior resp.
  • AU Jun. DEWR Skilled Vacancies out at -2.0% m/m vs. revised -1.9% prior
Upcoming Economic Calendar Highlights
(All Times GMT)
  • Norway Credit Indicator Growth (0800)
  • UK Index of Services (0830)
  • UK Consumer Credit (0830)
  • UK Mortgage Approvals (0830)
  • UK M4 Money Supply (0830)
  • EU Business Climate Indicator (0900)
  • EU Euro-zone Confidence Surveys (0900)
  • Swiss KOF Leading Indicator (0930)
  • CA CPI (1100)
  • US MBA Mortgage Applications (1100)
  • CA Teranet/National Bank House Price Index (1300)
  • US Pending Home Sales (1400)
  •  

Technical Analysis for Precious Metals

Silver

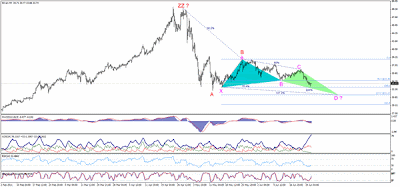
Since C wave of ZZ formation is somewhat complicated, we will analyze silver through a combination between harmonic patterns and Elliot waves. We will use a harmonic pattern that will connect the prior corrections appropriately, and a butterfly harmonic shape is the best one in this case as the metal is stable below 34.35 zones. This aforesaid harmonic structure suggests that the bearishness will continue towards 32.95 zones and a break of which will take us towards 31.35 where the first PRZ of the pattern exist. ADX reinforces the bullishness, while MACD is negative. RSI shows oversold signal and Stochastic might cause fluctuation during the downside journey.
The trading range for today is among the key support at 31.35 and key resistance now at 35.65.
The general trend over short term basis is to the downside targeting 26.65 as far as areas of 48.50 remain intact with weekly closing.
Support: 33.60, 33.10, 32.82, 32.45, 32.20
Resistance: 33.90, 34.35, 34.80, 35.00, 35.65
Recommendation Based on the charts and explanations above our opinion is, selling silver around 34.00 gradually targeting 33.05,32.45 and 31.35, while the stop loss is a daily closing below 35.65 might be appropriate.

Gold

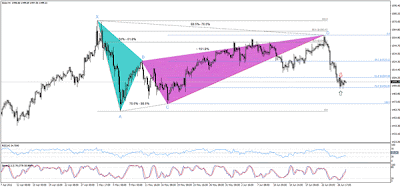
Trading is trapped between 61.8% and 76.4% Fibonacci retracement levels of CD leg for the harmonic structure as seen on the image at 1505.00 and 1492.00. The sideways direction between those levels makes the trend unclear despite RSI providing oversold signs. Stochastic is moving positively but it approaches overbought areas gradually. Henceforth, we prefer staying aside over intraday basis.
The trading range for today is among the key support at 1474.00 and key resistance now at 1532.00.
The general trend over the short term basis is to the upside targeting 1600.00 per ounce as far as areas of 1430.00 remain intact with weekly closing.
Support: 1492.00, 1488.00, 1480.00, 1477.00, 1474.00
Resistance: 1505.00, 1513.00, 1525.00, 1532.00, 1537.00
Recommendation Based on the charts and explanations above our opinion is, staying aside until a clearer sign appears to pinpoint the upcoming big move.
disclaimer: The content of ecPulse.com and any page in the website contain information for investors/traders and is not a recommendation to buy or sell currencies, stocks, gold, silver & energies, nor an offer to buy or sell currencies, stocks, gold, silver & energies. The information provided reflects the writers' opinions that deemed reliable but is not guaranteed as to accuracy or completeness. ecPulse is not liable for any losses or damages, monetary or otherwise that result. I recommend that anyone trades currencies, stocks, gold, silver & energies should do so with caution and consult with a broker before doing so. Prior performance may not be indicative of future performance. Currencies, stocks gold, silver &energies presented should be considered speculative with a high degree of volatility and risk


Gold and Forex Technical Analysis

EUR/USD: Euro is currently trading at 1.4290 levels. Euro bounces heavily against the greenback on optimism on Greek austerity votes and speculation that the latest bailout involves replacing existing Greek debt with 30yr bonds guaranteed by the EIB or EFSF. Looking ahead GfK German Consumer Climate data is expected weaker and German Prelim CPI m/m data is expected better. Support is seen around 1.4225 levels (55 days daily EMA) while resistance is seen at 1.4320 levels (100 days 4hrly EMA). EUR/INR (64.27): Exporters can cover short term exposure at current levels while importers can cover on dips near 63.30 and below. EUR/INR is likely to trade in the range of 64.05-64.52 levels today. Short term: Bearish. Medium term: Bearish

GBP/USD: The Sterling is currently trading at 1.5979 levels. Looking ahead Current Account data is expected better and Final GDP q/q is expected neutral. Support is seen at 1.5920 levels and resistance is seen at 1.6006 levels (21 days 4hrly EMA). GBP/INR (71.84) Exporters can cover short term exposure near 72.40 levels while the importers can wait to hedge near 71.50 levels. GBP/INR is likely to trade in the range of 71.55-72.10 levels today. Short term: Bearish. Medium term: Bearish

AUD/USD: The Aussie is currently trading at 1.0469 levels. Support is seen at 1.0417 levels (21 days weekly EMA) and resistance is seen at 1.0490 levels (21 days 4 hrly EMA). Exporters are suggested to book exposure around 1.0600 levels while Importers can cover partially their near term exposure at 1.0200-1.0300. Short term: bearish. Medium term: Maintain neutral.

JPY: Yen is currently trading at 80.81 levels. Support is seen at 80.56levels (21 days Daily EMA) while resistance is seen at 81.07 levels (55 days daily EMA). Yen Exporters are suggested to book exposure below 80.00 and Importers can cover above 81.00 levels. Outlook: Short term to medium term: Maintain Bearish for the pair.

Gold: Gold is currently trading at 1499.89 levels after making a low of 1490.44 levels. Gold is under selling pressure as rising dollar eroded the appeal of precious commodities as an investment. Support is seen at 1488.35 (100 days daily EMA) while resistance is seen at 1513.76 levels (55 days daily EMA). Outlook: Medium term Bullish.

Oil: Oil is currently trading at 90.90 levels. Support is seen around 90.00 levels while resistance is seen at 91.60 levels (21 days 4 hrly EMA). Outlook: short term Bearish, Medium term neutral.

Dollar Index: DI is currently trading at 75.28 levels. Dollar is weak across the board as slight risk sentiment takes over on positive results from Greek austerity votes. Looking ahead S&P/CS Composite-20 HPI y/y data is expected weaker and CB Consumer Confidence data is expected neutral. Support is seen at 75.08 levels (55 days daily EMA) and resistance is seen at 75.75 levels (100 days daily EMA). Outlook remains Bullish for Short Term and Medium Term: Bullish (Post June - July).


FX Update: EUR nervous, but don’t forget about end of QE2!

Greek debates on new austerity measures are underway, with a vote coming up mid-week. Meanwhile, EURUSD is caught in a nervous range. But let’s not forget this is also the week the US Fed’s QE2 ends.

EURUSD tried the lower end of the range and the rising line of consolidation top open the week in early trading, as sovereign debt spreads at the EuroZone periphery widened even further and risk was clearly off. But the early European session showed that the Euro is not ready to break out of the range just yet, as the spreads partially compressed again and the Euro turned sharply and rallied well over a figure off the lows.

The mood is very uncertain as the market mulls whether the Greek parliament will vote in favor of the new austerity package, dubbed the Medium Term Fiscal Strategy (MTFS) on Wednesday.  This is the first immediate step toward near term stability for Greece, as it is assumed that the next tranche of the existing bailout plan would be disbursed upon approval of the MTFS since that plan was rubber stamped by the EU recently. Beyond that, EU finance ministers will be meeting this Sunday and on July 11 to discuss the next bailout plan for Greece. An interesting piece discussed by ZeroHedge looks at how the ECB and the markets might react if the Greek austerity package fails to get approval, which would throw everything into disarray: http://www.zerohedge.com/article/what-if-greece-says-no . Very interesting reading. The market, while fretting the situation, is still pricing a rejection vote at very low odds.

Meanwhile, Sarkozy has advanced a plan for French banks – which are the most exposed to Greek debt – to voluntarily rollover 70% of their holdings into 30-year bonds with a special interest rate. Of that 70%, 20% would bizarrely be linked to zero coupon bonds linked to “high-growth stocks”. Germany has expressed interest in the plan on its own banks’ behalf. Avoiding the declaration of a default and all it entails is the weakness of these kinds of plans, and Greece would still have to cough up the 30% at roll-over under such a plan. This looks like classic extend and pretend from where we sit.

The headline risk this week is severe, but the Wednesday vote is the most critical known event. Further out, assuming Greek passage, we’ll have to watch out for the potential of various efforts to disrupt the new bailout package.

QE2 to expire this week
Let’s not forget that the first four days of this week are the last four days of the Fed’s QE2 monumental bond buying program, which will mean the removal of - roughly - 80 billion USD per month of “liquidity”, or whatever one might choose to call it, from the system. There will still be a residual bond buying after Thursday that is driven by the Fed maintaining the size of its balance sheet on redemptions  of mortgages, etc. One possible scenario for the end of QE2 is that the current round of dread/risk-off/USD up continues in the next couple of days ahead of the event but then yields to a buy the fact (buy risk sell USD) on Friday or early next week. This setup  - and the USD picture in general - is likely to play out more purely in the likes of AUDUSD rather than EURUSD due to the difficulty here in separating the headline risk of Europe from flows driven by the fears over the implications of QE2 expiry.

Odds and ends
USDJPY continues to manage to trade above the key 80 area as rates have eased a bit higher at the front end of the US yield curve today on anticipation of this week’s treasury auctions (2-year today, more later this week ). As well, Moody’s was out grumbling about the lack of fiscal credibility after Japan failed to meet its original timetable on a long term plan for dealing with its public debt. Perhaps because there is no credible way to approach the problem, one wonders?

New Zealand’s May trade balance figure came out smaller than expected on a larger than expected import figure and one wonders if the “rebuilding from the earthquake” trade could begin to weigh on the kiwi as the “Chinese capital inflows” trade has possibly faded out. In any case, when risk is off as it has been lately, it is tough to build a bullish case for NZDUSD, which today is pressing on the psychologically significant 0.8000 level, just below the 55-day moving average, which was an important support level on the previous sell-off wave.

Looking ahead
Big event risks this week that are known (Greek vote and end of QE2) and the constant risk of random headlines on the sovereign debt crisis peppering traders from the EU could shake things around both ways as we have become accustomed to of late. The US treasury auctions this week are an interesting test of the bond market after its most persistent rally in years of late, particularly for USDJPY and possibly USDCHF, though CHF is more exposed to Euro sentiment. Watch out for the ad hoc risk of noise from the SNB or Swiss government on CHF strength this week – the franc is beginning to look scary for Swiss officialdom.

On the broader risk appetite front, it’s very relevant to watch the 200-day moving average in the S&P 500, which has twice been tested over the last several trading days. A close below that MA could open up a can of bearish worms for technicians and market timers. On the FX front, the risk barometer equivalent, AUDUSD, has broken its recent range and is trading at an 11-week low.

Chart: AUDUSD
AUDUSD is finally trading below the recent range today after plenty of evidence had been building for some time against the Aussie’s case, as we have pointed out, and after several feints that were initiall rejected. The move lower opens up to the 1.0260 area of the previous structural high. Any significant damage below that level would provide the first building blocks for the end of the bull market in the currency pair.
Exercise extreme caution in these markets. 
Economic Data Highlights
  • New Zealand May Trade Balance out at +605M vs. +1000M expected and +1148M in Apr.
  • UK Jun. Hometrack Housing Survey out at -0.1% MoM and -3.9% YoY vs. -3.7% YoY in May
  • Sweden May Trade Balance out at 5.7B vs. 6.0B expected and 4.0B in Apr.
  • US May Personal Income out at +0.3% MoM vs. +0.4% expected
  • US May Personal Spending out at 0.0% MoM vs. +0.1% expected
  • US May PCE Deflator out at +2.5% YoY as expected and vs. +2.2% in Apr.
  • US May PCE Core out at +0.3% MoM and +1.2% YoY vs. +0.2%/+1.1% expected, respectively and vs. +1.1% YoY in Apr.

Upcoming Economic Calendar Highlights (all times GMT)
  • US Jun. Dallas Fed. Manufacturing Activity (1430)
  • US Fed’s Kocherlakota to Speak (1500)
  • US Fed’s Hoenig to Speak (1700)
  • UK BoE’s Posen to speak in Scotland (1700)
  • Japan May Retail Trade (2350)
  • Australia RBA’s Debelle to Speak (0100)

Funds reduce long positions on lower growth and Greece

Last week Hedge Funds and Money managers cut their net-long positions in 18 U.S. commodities by 13 percent to 1.13 million futures and options contracts in the seven-days ended June 21, data from the Commodity Futures Trading Commission show.

That’s the biggest decline since May 10 and managers reduced bullish bets for the third week in a row.

Funds slashed bets on rising agricultural prices by the most in three months, led by declines in holdings of wheat and coffee, as supply concerns eased amid signs the global economy may slow.

Speculators reduced their net-long position in 11 U.S. farm goods by 12 percent to 674,396 futures and options contracts in the week ended June 21, government data compiled by Bloomberg show. That’s the biggest drop since mid-March. Investors turned net-short, or bet on declines, on wheat for the first time since late November. Coffee holdings tumbled 65 percent.

Wheat prices have tumbled 16 percent in June, heading for the biggest monthly drop since October 2008. Investors held a net-short position of 8,570 contracts as of June 21, compared with net-long holdings of 7,558 contracts the previous week.
 Background information: The Commitments of Traders is a report issued by the Commodity Futures Trading Commission every Friday with data from the previous Tuesday. It comprises the holdings of participants in various U.S. futures markets split into "commercial" and "non commercial" holdings. The non commercial or speculative holding are typically institutional investors such as hedge funds and CTAs. The above chart tracks a total of 27 different commodities split into sectors. 

Daily Report: Euro Weak on Greece, Despite China Support

Euro remains weak and hovers around record low against Swiss franc as the week starts. Uncertainties in the Greece situation is still in traders' mind and is weighing on the common currency. The parliamentary approval of the new austerity measure later this week is expected by most, but the outcome is far from being certain. Greece deputy prime minister warned on Sunday that some lawmakers might block some of the reforms. Indeed, the situation will remain unclear as some lawmakers would refrain from making clear their stance until the last minute. And more importantly, traders are also lightening their bet as the Euro could have very different reactions to the vote outcome. Logically, parliamentary approval of the austerity should clear the hurdle for getting the next tranche of bailout from EU/IMF and should be Euro positive. But that could turn out to be a sell-on-news scenario in EUR/USD.

Chinese Premier Wen Jiabao expressed his backing to Europe over the weekend by pledging to keep investing the the regions' sovereign bond markets. Wen told BBC that China has actually increased the purchase of government bonds of some European countries, and we haven't cut back on our euro holdings." And he said that showed China's "confidence in the economies of the European countries and the eurozone." Also Wen stressed that "friendship and cooperation between China and European countries are most keenly shown in the times of difficulties."


The Bank of International Settlement warned in its annual report that "the prolonged period of very low interest rates entails the risk of creating serious financial distortions, misallocations of resources and delay in the necessary deleveraging in those advanced countries most affected by the crisis. And, "tighter global monetary policy is needed in order to contain inflation pressures and ward off financial stability risks." And currently, many emerging markets now "run the risk of building up imbalances very similar to those seen in advanced economies in the lead-up to the crisis", and that's property prices advancing in "staggeringly rapid rates, price sector indebtedness "rising fast".


On the data front, New Zealand trade surplus came in narrower than expected at NZD 605M in May. US personal spending and income will be the main focus. Income in expected to rise 0.4% in May while spending is expected to up 0.1%. Inflation is expected to be subdued with core PCE at 1.1% yoy even though headline PCE should climb to 2.4% yoy.

NZD/USD is notably weaker today on risk aversion as well as the disappointing trade figure. A near term top was formed earlier at 0.8300 and consolidations from there will likely extend further to 0.7755 support and below. At this point, there is no sign of medium term reversal yet and hence, we'd expect strong support from lower trend line (now at 0.7312) to contain downside and bring rebound. 

EUR/JPY Daily Outlook


Daily Pivots: (S1) 113.93; (P) 114.67; (R1) 115.50;


EUR/JPY continues to consolidate above 113.49 temporary low and intraday bias remains neutral for the moment. Nevertheless, note that near term bearish outlook is also unchanged with 116.69 resistance intact and recent fall from 123.31 is still expected to resume sooner or later. Break of 113.41/49 support zone will target 61.8% projection of 121.83 to 113.41 from 117.88 at 112.67 first and then 100% projection at 109.46 next. On the upside, though, break of 116.69 will suggest short term bottoming and will turn focus to 117.88 resistance for confirmation.


In the bigger picture, it's getting more likely that choppy rebound from 105.42 is merely a correction in the down trend from 2008 high of 169.96 and has finished at 123.31 already. In other another low below 105.42 is likely. Nevertheless, we'd start to look for reversal signal again around 100 psychological level unless weekly MACD would break it's up trend line. On the upside, break of 123.31 resistance should now confirm medium term reversal and should target 139.21 key resistance.


Weekly Review and Outlook Swiss Franc Broadly Higher on Risk Aversion, Eurozone Uncertainties, Fed No QE3

Eurozone and Greece news dominated headlines last week but it was Swiss Franc that shone over the week, making new record highs against both Dollar, Euro and Sterling. Greece Prime Minister Papandreou passed the confidence vote by a thin margin and will face parliamentary vote on the new austerity package this week before finally getting EU approval on the fifth bailout fund payment will be approved on July 3. Everybody in the markets is expecting the the Greece funding to be approved eventually but remained cautiously as this is still far from certainty. Meanwhile, worries on contagion never go away as Moody's turned focus to Italy and said it's considering downgrading a group of Italian banks. The debt crisis in Eurozone continued to weigh on market sentiments.

On the other hand, investors are clearly dissatisfied with Fed's outlook and the lack of talk on QE3. After the FOMC meeting, Fed Chairman Bernanke signaled that there will be no QE3 after expected completion of QE2 in June. Tone of the accompanying statement was less optimistic than the last one as the Fed noted that recovery is continuing "somewhat more slowly than the Committee had expected." Fed also lowered GDP projection and raised unemployment projection.Economic data from US were generally soft and affirmed the view of slowdown in general.

Sterling was also one of the weakest currency after the dovish BoE minutes. Vote split of the June meeting changed from 6-3 to 7-1 in favor of no change after arch-hawk Sentance left the committee and was replaced by Broadbent, who joined the doves camp. Dale and Weale were the only hawk left, who voted for 25bps hike. The minutes were overall quite dovish as members' focus moved away from inflation threat to the fragile economic recovery. The minutes suggested that a near term hike is highly unlikely and BoE would instead keep rates unchanged until next year. Indeed, the note that the risk of undershooting the 2% inflation target over the next few years has increased. Meanwhile, some members thought "it was possible that further asset purchases might become warranted if the downside risks to medium-term inflation materialized."

Stocks and more notably, commodities, were generally lower after a volatile week. DOW finished the recovery from 11862 and dipped sharply since then. Technically, DOW is held below the falling 55 days EMA, thus, keeping the outlook bearish. We'd expect correction from 12890 to resume in near term, probably early this week to 38.2% retracement at 11639 and possibly further to below 11555.48 support. Such development would likely provide some support to the greenback. 

The CRB commodities index also resumed the whole fall from 370.70 and reached as low as 326.88 last week. Crude oil breached 90 level and remained weak. Meanwhile, gold is back pressing 1500 level and should have reversed the near term trend. Broad based weakness in commodities should send the CRB index through 323.54 retracement level, possibly to 100% projection of 370.7 to 332.92 from 352.05 at 314. And the development should also provide support to dollar.

However, the tricky part of intermarket outlook is that dollar index is not having decisive strength yet as it's still kept below 76.36 resistance and doesn't sustain above medium term falling trend line from 88.70 yet. We'll continue to stay neutral. Note that break of 76.36 resistance should confirm medium term reversal on bullish convergence condition in daily MACD. And, in such case, we should see further rally in the dollar index through 77.17 projection target and possibly to 38.2% retracement of 88.70 to 72.69 at 78.80 at least. 
 So far, EUR/USD has been holding firmly above 1.4 level in spite of all the volatile price actions. And that's the major factor that's restricting dollar index's rise. On the other hand, if the above risk-off movements realize, swiss franc will likely continue to be the main beneficiary. GBP/CHF made another record low at 1.3271 last week and the downtrend is accelerating as seen in the falling, negative, weekly MACD. Near term outlook remains bearish as long as 1.3614 resistance holds and the down trend should extend to next medium term target of 61.8% projection of 2.4965 to 1.5112 from 1.8113 at 1.2024. 

The Week Ahead
Greece's parliamentary vote on the austerity measures will definitely be a major focus of the week. In addition, as markets are clearly in a risk-off mode currently, much volatility would be triggered by the growth data this week, in particular the PMI data from China, Swiss, UK and the US ISM manufacturing. Another key event would be UK inflation report hearings where analysts would scrutinize the words from BoE policy makes to affirm the view that the bank would stand pat for the rest of this year.
  • Monday: New Zealand trade balance; US personal spending and income
  • Tuesday: Japan retail sales; Swiss UBS consumption indicator; German Gfk consumer sentiment, Prelim CPI; UK current account; GDP final, inflation report hearings; US S&P Case-Shiller house price; consumer confidence
  • Wednesday: Japan industrial production; Swiss KOF leading indicator; Canadian CPI; US pending home sales;
  • Thursday:UK nationwide house price; German unemployment, Eurozone M3, CPI flash; Canada GDP; US jobless claims, Chicago PMI
  • Friday: Japan CPI, quarterly tank an; China PMI; Swiss SVME PMI; UK PMI manufacturing; Eurozone unemployment; US ISM manufacturing

EUR/CHF Weekly Outlook

EUR/CHF dropped to new record low at 1.1802 last week and met mentioned target of 100% projection of 1.3833 to 1.2399 from 1.3243 at 1.1809. Initial bias remains on the downside this week and sustained trading below 1.18 should pave the way to long term projection target at 1.1516. On the upside, above 1.1968 minor resistance will turn bias neutral and bring consolidations. But sustained trading above near term falling channel (now at 1.2103) is needed to be the first signal of short term bottoming or we'll stay bearish.
In the bigger picture, whole down trend from 1.6827 (2007 high) is still in progress and in any case, medium term outlook will remain bearish as long as 1.3243 resistance holds. The current down trend should now target 138.2% projection of 1.8234 to 1.4391 from 1.6827 at 1.1516.
In the long term picture, fall from 1.6827 should be resuming whole down trend from 1993 high of 1.8234. The is some side of re-acceleration as seen in weekly MACD and break of 138.2% projection of 1.8234 to 1.4391 from 1.6827 at 1.1516 will target 161.8% projection at 1.0609.


Why You Can't Afford Food And Gas Anymore

The Federal Reserve Is Why You Can't Afford Food and Gas

The Federal Reserve is supposed to promote full employment and stable prices, yet its actions cause jobs to disappear and prices to rise. This should come as no big surprise, at least it shouldn't if you're not inclined to think government intervention is either desirable or productive. The Fed is government intervention at its purest: the central bank with the legal monopoly on the creation of new money.

The Fed has essentially one trick. It can legally conjure new money whenever it wants. With this one trick it manages to force interest rates down. Mainly it lends the new money to the U.S. government. That is to say, it buys government bonds. 

The artificial demand the Fed creates by throwing billions of dollars at government bonds has a depressive effect on interest rates. But these lower interest rates are not a result of those free market forces we champion at the Whiskey Bar. Rather, they are the result of the machinations of a government-chartered bank with a monopoly on the issuance of currency.

The Federal Reserve's goal is to make borrowing more attractive because of the lower interest rates...but the boom that results is one built on debt that must eventually be serviced...and inevitably at higher rates.

The Fed also loves it when lower rates make lending money or putting it in interest bearing savings accounts less attractive to investors. People instead seek returns in other markets...like stocks. This is supposed to be a good thing. Notice Ben Bernanke points to a rising stock market as proof that his orchestrations were masterful.

But all he really did—all central bankers really ever do—is create new money and shovel it into circulation. Creating money to encourage mass indebtedness and speculative investing, however, isn't exactly a winning strategy. It's like taking up smoking so the nicotine will help your concentration when you're picking the ponies. Or something like that.

You'll notice that the stock market is responding less and less to the byzantine stimulus of lower bond yields. And people are up to their eyeballs in debt, and interest rates are rising despite the Fed's efforts. This is your classic "pushing on a string" scenario. It's rather like the point at which more alcohol starts shutting down the imbiber's autonomic functions instead of producing more drunken bliss.

The stimulus of treasury-buying with new money is now having the opposite of the intended effect. After the initial euphoric response, things are getting worse.

And then there's the matter of all that new money...

We're not sure why central bankers and so many economists believe that new money can be created out of thin air—without any corresponding increase in economic activity or actual wealth—and inflationary results somehow be avoided...as if the new money will conveniently behave itself and keep from being used to bid up general price levels!

There wouldn't be much of a problem if the Fed had only created just a few hundred new dollars...even thousands. Enough, say, to buy the legal counterfeiters cool new cars and some snazzy threads. But we're talking about the creation of billions upon billions of new dollars here. Those dollars are sloshing their way through the economy and they're going to show up more and more in the general price levels. (Their very creation also makes some of the other big holders of U.S. debt—like the governments in Asia—worried about being paid back with money that's worth far less in real terms.)

Those new dollars have to get spent into circulation to do their damage, but that's never a problem. Whoever gets them first will get to benefit before prices go up (and those prices go up at all because the new money is being spent in the first place!)

Cui bono? Why, those to whom the Fed hands the dough first. Traditionally that's meant the government whose debt the Fed buys with the money it wills into existence, but lately the Fed has seen fit to hand new money straight to banks, because after all this is a crisis. Apparently you fix crises you engineered in the first place by bailing out your cronies in the big banks.

The government uses that money to pay the staff in its countless departments, contractors, military and others counting on a government check. The banks use the money to pay their senior members enough to keep them in million-dollar Manhattan apartments.


The rest of us get to beg our employers to give us raises that keep up with this mysterious price inflation. But it's really not so mysterious. It happens as the first-users of new money drive up the prices on the things we all need...like food and energy.


The new money doesn't simply go into the prices that the Fed would like it to, like stocks. It gets all over the place. The least connected, the very poorest farthest away from the new money feel the effects first. In our modern global system, that means that a family in a "developing country" will find themselves paying around half of their meager daily income for the food that used to take only a quarter of it. Eventually they may find that they can't afford much food at all.


The typical middle class American is only just barely feeling the pinch now, but there's a lot more pain to be felt. In 2010 Americans spent around 5% of their incomes on food. Things could be a lot worse. In fact, they likely will be soon enough. Increased food and energy prices are currently only a drag on consumer spending. Eventually, however, the essentials could get costly enough to cause serious privation.


The threat of mass starvation tends to lead to all sorts of unpleasantness. Individuals can do prepare by saving in real money
(gold and silver and copper-nickel), but that does nothing to remedy the discontent and likely rioting from the millions of others who will not be so prepared.
We can't say how much of this future woe is already baked in. We do know that more quantitative easing will just make a bad situation worse. It's not idle speculation. History shows again and again that unbacked money creation by governments and central banks only leads to misery.

The pundits are debating whether or not QE3 will follow anytime soon or if will even follow at all. Let them hash it out. In the meantime, if you can't or won't get out of the U.S. entirely, you might want to consider at least not being in the middle of any large population centers.


Regards,


Gary Gibson.
 
Whiskey & Gunpowder

Oil intervention replacing Fed intervention

The summer lull in commodity markets will arrive late this year with raised levels of volatility on the back of a barrage of breaking news.

The main market mover this week was the surprise and somewhat controversial announcement from the International Energy Agency that oil consuming nations will release 60 million barrels of oil over a thirty day period. This is indeed only the third time in three decades that such measures have been implemented by the IEA.

With OPEC having failed to reach consensus on a production increase and the U.S. Federal Reserve ceasing quantitative easing in a week’s time it was felt that something else had to be done in order to stimulate the global economic recovery which has been failing recently, not least due to the high cost of energy.


The reason why the market was caught so unprepared for this announcement was primarily due to the belief that Saudi Arabia was in the process of turning up its tap to ensure adequate supplies into the critical autumn period where the expectation is for a considerable tightness in the market. This has helped reduced prices over the last couple of weeks but the IEA clearly felt that more was needed as bottlenecks were still evident due to the continued loss of high quality Libyan oil.

The IEA has a total of 1.3 billion barrels of strategic reserves available for such actions with the U.S. alone holding more than 700 million government controlled barrels in underground storage. On that basis it was not a surprise that the U.S. will be contributing half of the 60 million barrels announced yesterday. As expected the immediate reaction was a steep drop in prices. Brent crude, the leading benchmark for global oil transaction, lost 6 percent and is currently down some 15 percent from the April high but is still one third higher than the 2010 average. 

Interestingly Brent crude failed to breach the April low of 105.15 on the news and this could indicate that although we will see a lower range over the summer, potentially between 104 and 115, we would be surprised to see a revisit of the 100 dollar level. For that to happen we will have to see global economic activity deteriorate even further, something that may just have been halted by this action from the IEA.
The longer term risk still firmly points towards higher prices as rising demand will continue to challenge low levels of spare capacity. The IEA’s executive director said that a price spike was feared without the action taken. This is obviously a worrying sign for the future should the Libyan crisis continue as additional releases would not have the same effect.
The Reuters Jefferies CRB index is down 2 percent on the week with all the gains for the year having been erased. Commodities have generally been struggling during May and June on the back of a slowdown in global economic activity and improved projections for agricultural production this autumn.
With the half-year mark coming up it is also worth having a look at the performance year to date and it is a very mixed picture that’s emerging. All three major commodity indexes are back to zero performance on the year so it is all to play for in the second half.
 
Grain markets have come under some considerable pressure during June as much improved weather has removed some of the worries that caused prices to rally during the sowing season. The S&P GSCI grain index is currently down by 6.5 percent on the year as losses in especially wheat have helped remove some of the inflationary pressures from this sector.

Russia has lifted its export ban on wheat and the Agriculture Ministry there now estimates that the total grain harvest may reach 90 million tonnes, up from 61 million tonnes last year. Significant weather improvements and a 10 percent increase in planted acres should help bring about this much improved situation. The price of high quality milling wheat in Europe fell 6.5 percent on the week as the Russian news combined with the improved weather situation within the European Union has helped remove some of the previous price pressure.

The drought that hit Russia last year did not occur until July and August so until the crop is in the bag the market will continue to trade nervously with weather forecasts being the main driver over the coming weeks.

Gold had an unusually volatile week as a break above the recent high at1,550 was followed by the biggest decline in seven weeks as it got caught up in a general round of risk aversion. Weak economic data from China to the U.S. combined with the IEA announcement had investors heading for the exit across different assets and gold was not immune from this move. As we head into the summer months, which are normally a time of year with weak demand, further losses towards 1,485 can not be ruled out although fundamentals continues to support the yellow metal in the months ahead.

The European carbon market has been suffering heavy losses at one point dropping more than 15 percent to the lowest in almost 15 months. The outlook for the sector looks uncertain and the price has come under pressure due to an oversupply of EU Emission Allowances (EUAs) combined with concerns about future economic growth and industrial activity in the EU. Furthermore the European Parliament has postponed a vote which should target a 30% emissions reduction after 2013. Failure to reach such an agreement will leave energy utilities with a large amount of unused EUAs which they then can sell.


Daily Report: Sentiments Reversed on Greek Austerity Deal, Euro Rebounded

Risk sentiments staged a drastic turn overnight while Euro rebounded strongly on news that Greece agreed with a team of EU/IMF on the new five-year austerity plan for securing the bailout fund. The measures, which will complete a EUR 78b austerity package, will now faces a parliamentary vote next week on June. EU finance ministers would then approve on July 3 the next payment of the bailout. That should help Greece cover around EUR 4b of maturing debts between July 14 and 22 and another EUR 3b of coupon payments within the month. Then on August, Greece will need to redeem EUR 6.6b of bonds. Greek Prime Ministers Papandreou pledged that there will be a "strong commitment" from Greece. DOW reversed earlier losses to 11874 and closed just -59pts lower, at 12050. Asian equities followed and were broadly higher. Euro managed to rebound strongly against dollar and swissy too.
DOW's strong rebound yesterday does suggest near term stabilization in market sentiments. But outlook remains bearish considering that it's still staying well below the falling 55 days EMA. Apparently, DOW has completed a five wave sequence from 9614 to 12876 and the correction from 12876 is still in favor to extend through 38.2% retracement at 11639, and possibly through 11555 support. We'll stay bearish in stocks as long as 55 days EMA (now at 12251) holds. And in case of another fall, the greenback would be boosted higher on risk aversion.
Outlook in the dollar index remains unchanged. It's still struggling to take out medium term falling trend line from 88.70 decisively. This is no clear indication of trend reversal yet even though bullish convergence condition is clearly seen in daily MACD. We'd prefer to see decisive break of 76.36 key resistance to fully turn bullish in the index or we'll stay neutral first. 
On the data front, Japan corporate services price index dropped -0.9% yoy in May. German Ifo business climate will be a main feature in European session and is expected to drop to 113.4 in June, but it would probably disappoint by having a deeper fall. From US, durable goods orders and finalized reading of Q1 GDP will be featured.

GBP/USD Daily Outlook

Daily Pivots: (S1) 1.5936; (P) 1.6005; (R1) 1.6072;
Intraday bias in GBP/USD remains on the downside with 1.6067 minor resistance and further decline is still expected. Decisive break of 1.5935 support will have medium term bearish implication and should target 100% projection of 1.6746 to 1.6058 from 1.6546 at 1.5858 first. On the upside, above 1.6067 minor resistance will turn bias neutral and bring consolidations. But near term outlook will remain bearish as long as 1.6262 resistance holds.
In the bigger picture, price actions from 1.3503 (2009 low) are treated as consolidation to long term down trend from 2007 high of 2.1161. Rise from 1.4229 is treated as the third leg of such consolidation and with 1.5935 support intact, such rise could still continue for 1.7043 resistance. But after all, strong resistance should be seen between 1.7043 and 50% retracement of 2.1161 to 1.3503 at 1.7332 to limit upside. On the downside, below 1.5935 support will indicate that rise from 1.4229 is completed and further break of 1.5344 will confirm this case and target 1.3503/4229 support zone.

Economic Indicators Update

 
GMT Ccy Events Actual Consensus Previous Revised
23:50 JPY Corporate Service Price Y/Y May -0.90% -0.80% -0.80% -0.70%
8:00 EUR German IFO - Business Climate Jun
113.4 114.2
8:00 EUR German IFO - Expectations Jun
106.3 107.4
8:00 EUR German IFO - Current Assessment Jun
120.8 121.4
12:30 USD Durable Goods Orders May
1.60% -3.60%
12:30 USD Durables Ex Transportation May
1.00% -1.50%
12:30 USD GDP (Annualized) Q1 F
1.90% 1.80%
12:30 USD GDP Price Index Q1 F
1.90% 1.90%


Ratings and Recommendations